2 - 11
2.3.3 Notes on fluorescence analysis
(1) Raman Scattering
When fluorescence is measured, two additional peaks may
appear in the spectrum. The Rayleigh peak appears at the
excitation wavelength and is due to scattered light, while
the Raman peak appears at longer wavelength than the
excitation. The position of the Raman band is dependent
on the excitation wavelength, while the position of the
fluorescence is independent of the excitation wavelength
though its peak height changes. Both Rayleigh and
Raman scatterings occur due to a solvent. Take care not
to mistake them for fluorescence peaks.
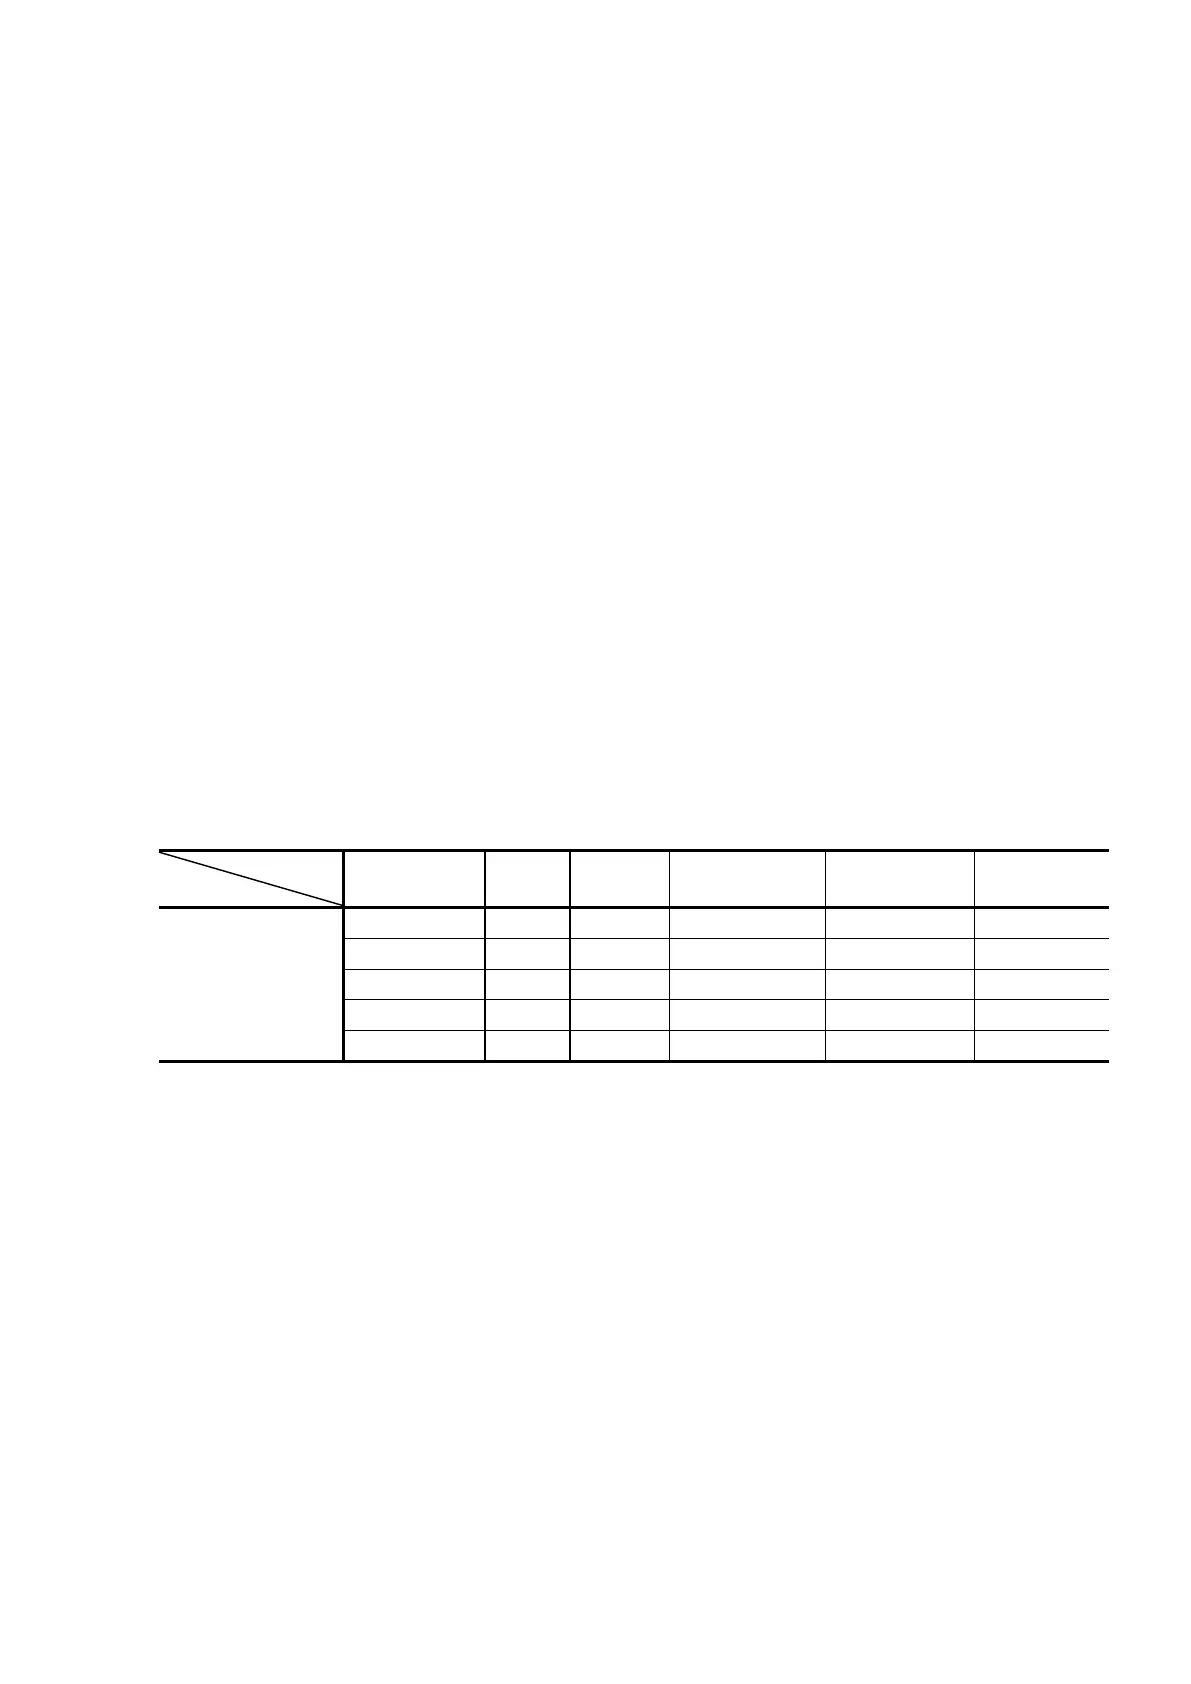
Table 3-2 presents the position of the Raman peak for a
variety of excitation wavelengths.
In liquid chromatography, the Raman scattering appears as
a background rise. This means that baseline noise
increases to disturb high-sensitivity measurement.
Table 2-5 Raman Spectral Peak Position at Each Excitation Wavelength