2 - 10
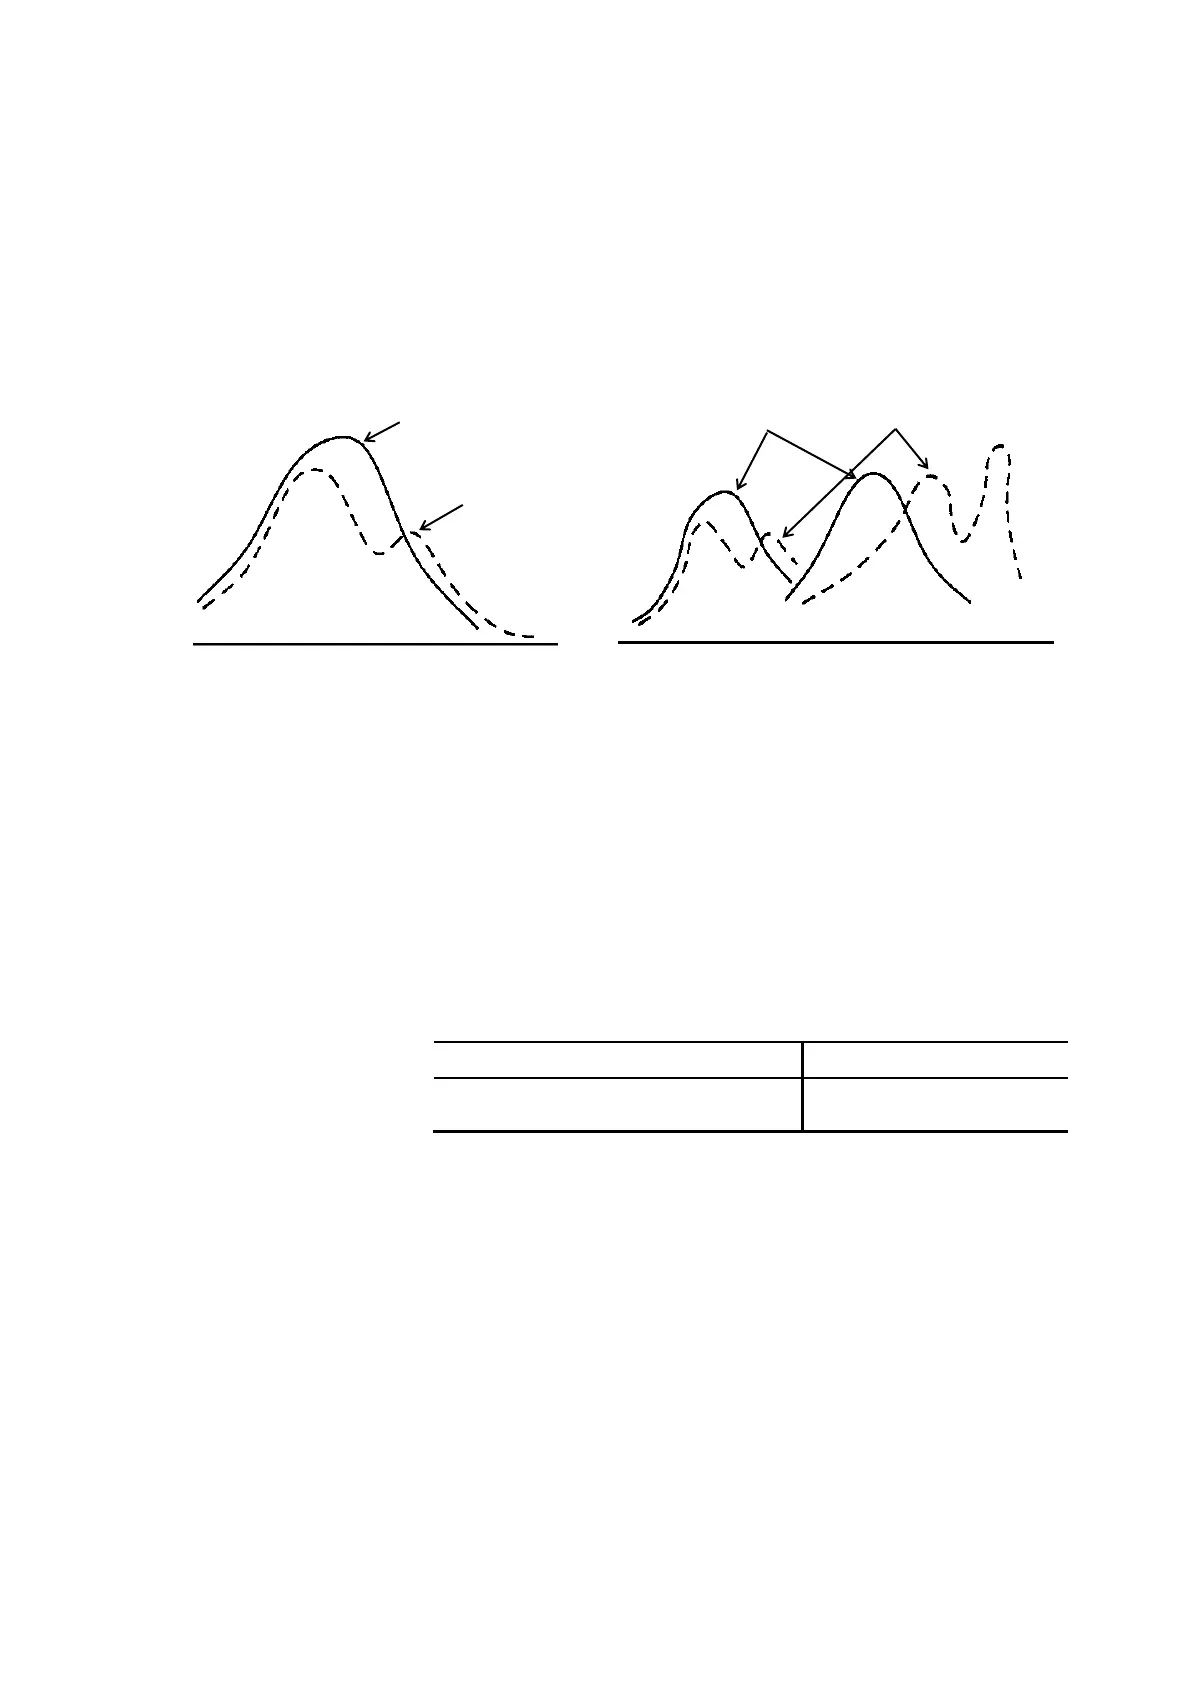
In contrast, if the fluorescence spectra do not overlap (Fig.
3-6 (b)), quantitative analysis of each compound can be made by
selecting the appropriate fluorescence emission wavelength
(even if the absorption wavelengths of two components are the
same).
Fig. 2-6 Spectroscopic Measurement of a Sample
Containing Two Components
Table 3-1 compares the analytical information obtained via
absorptiometry and fluorometry.
Table 2-4 Comparison of Analytical Information
Attainable with Absorptiometry and Fluorometry
 Loading...