STATUS
Version 1.0, 05/2015. Copyright 2012 Hitron Technologies
35
Version 1.0, 05/2015. Copyright 2015 Hitron Technologies
35
CDA3-35 User’s Guide
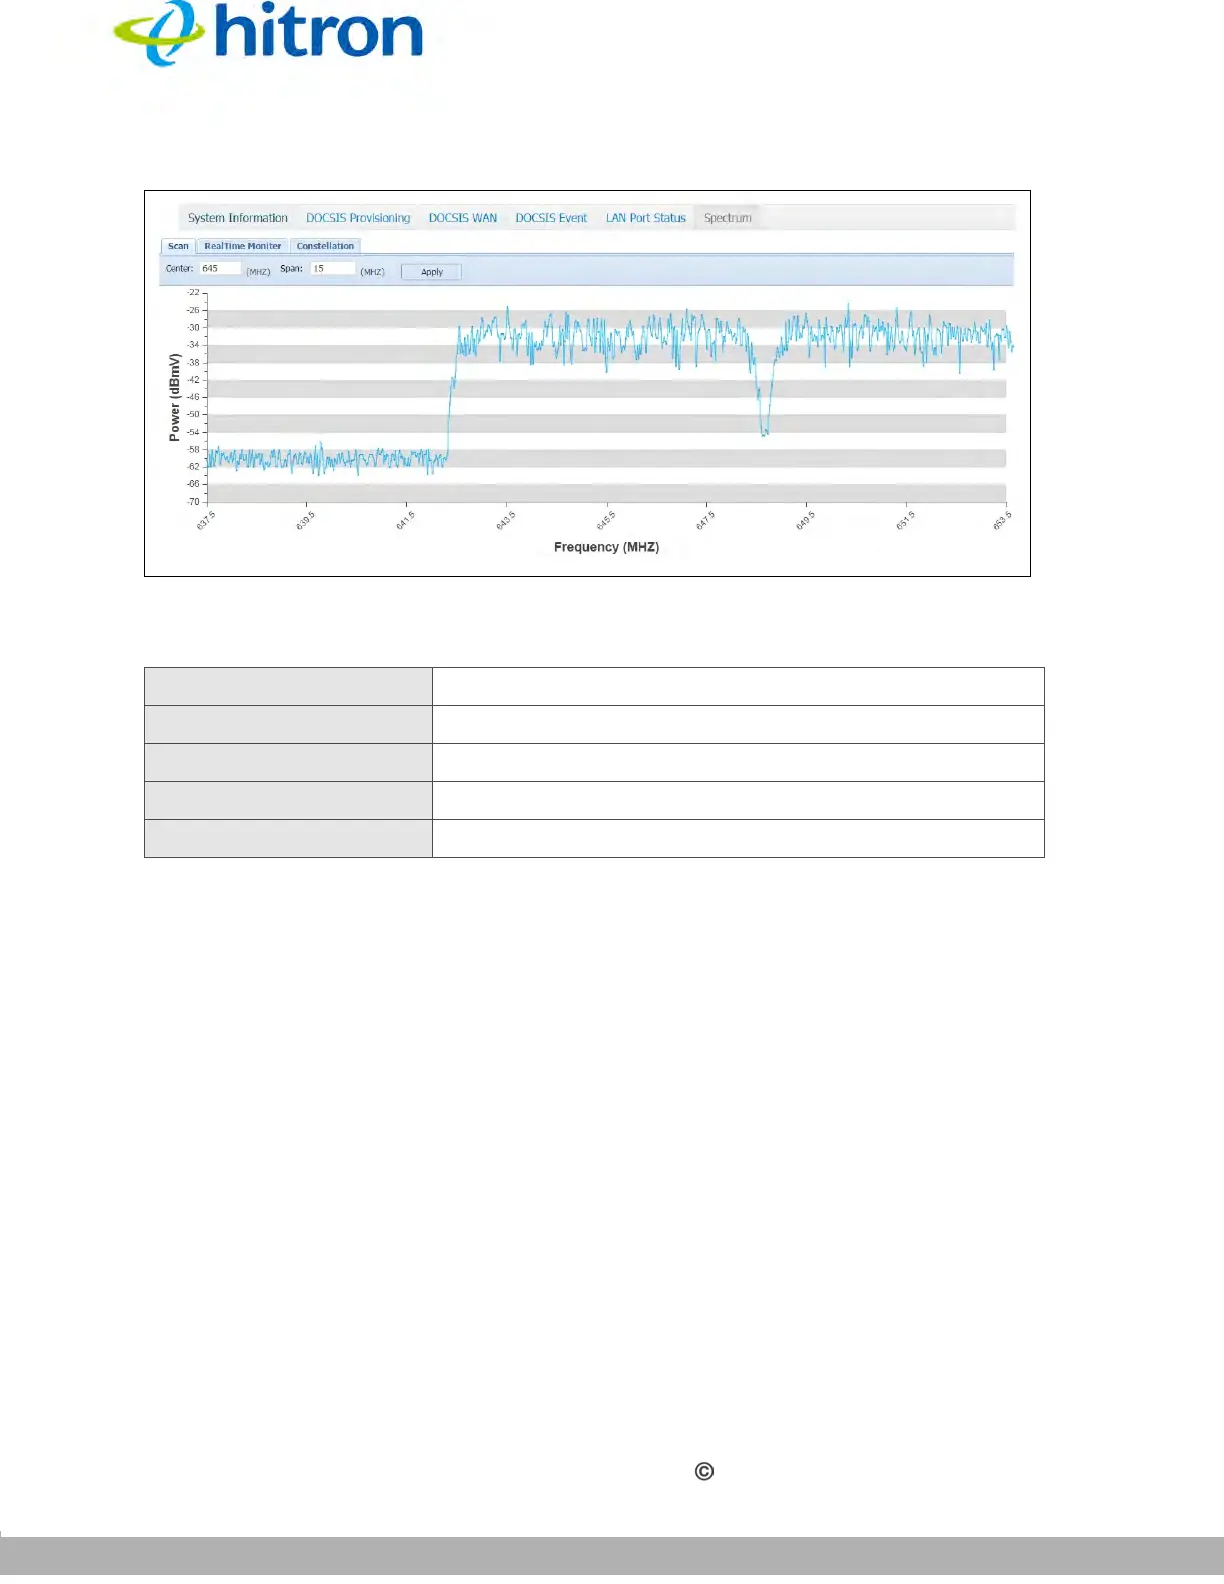
Figure 11: The Status: Spectrum Screen (Scan)
The following table describes the labels in this screen.
3.6.2 RealTime Monitor
Click Status > Spectrum, then click the RealTime Monitor tab. The following screen
displays.
Table 11: The Status: Spectrum Screen (Scan)
Center
Enter the center frequency of the scan.
Span Enter the frequency range of the scan.
Apply Click this to start the scanning.
Power (dBmV) This displays the power level of the spectrum.
Frequency (MHz) This displays the frequency of the measurement.