Appendix E: A Detailed Look at f 255
0 v
0.000 00
Keys lower limit into
Y-register.
“ 3
1 03
Keys upper limit into
X-register.
´ f 1
1.000 00
Approximation to
integral.
®
1.824 -04
Uncertainty of
approximation.
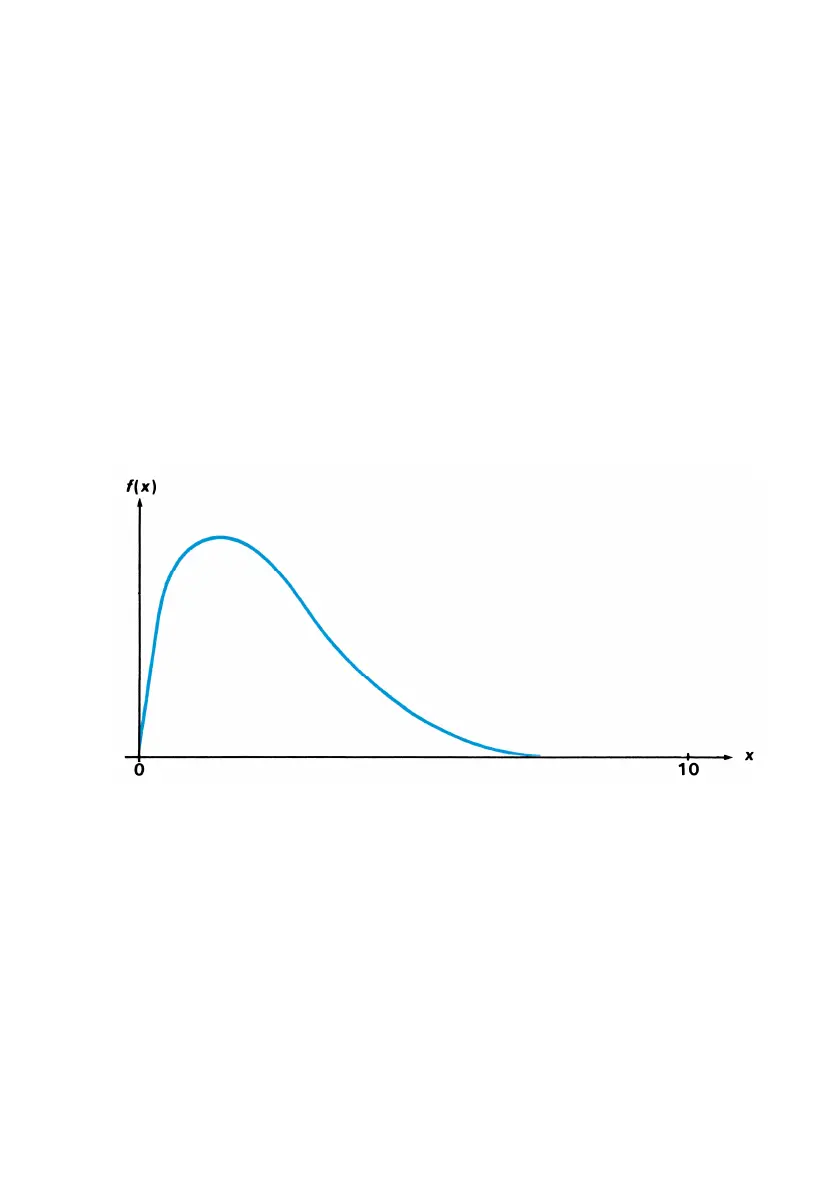
This is the correct answer, but it took about 5 seconds. To understand
why, compare the graph of the function over the interval of integration,
which looks about identical to that shown on page 252, to the graph of
the function between x = 0 and x = 10.
By comparing the two graphs, you can see that the function is
“interesting” only at small values of x. At greater values of x, the function
is “uninteresting”, since it decreases smoothly and gradually in a very
predictable manner.
As discussed earlier, the f algorithm will sample the function with
higher densities of sample points until the disparity between successive
approximations becomes sufficiently small. In other words, the algorithm
samples the function at increasing numbers of sample points until it has
sufficient information about the function to provide an approximation
that changes insignificantly when further samples are considered.
 Loading...