Section 4: Statistics Functions 55
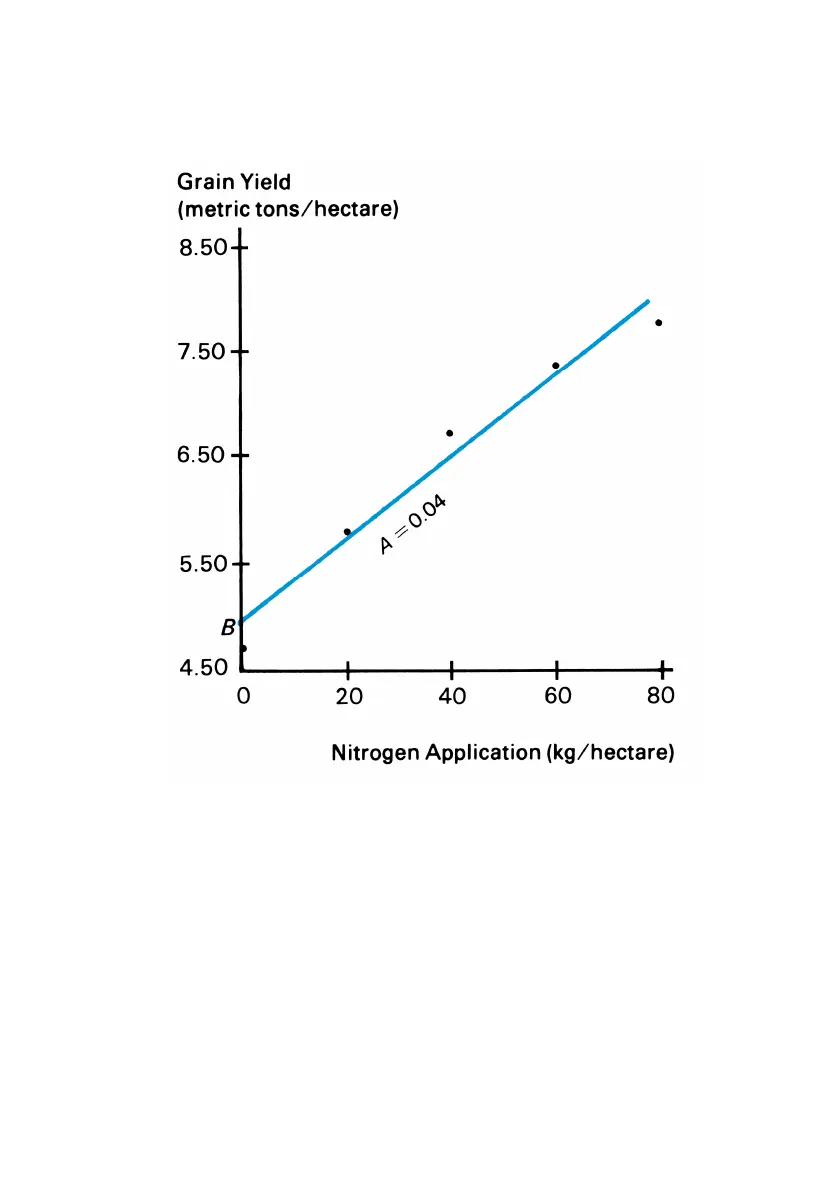
Example: Find the y-intercept and slope of the linear approximation of
the data and compare to the plotted data on the graph below.
Keystrokes Display
´ L
4.86
y-intercept of the line.
®
0.04
Slope of the line.
Linear Estimation and Correlation Coefficient
When you press ´ j the linear estimate, ŷ, is placed in the X-register
and the correlation coefficient, r, is placed in the Y-register. To display r,
press ®.
 Loading...