56 Section 4: Statistics Functions
Linear Estimation. With the statistics accumulated, an estimated value
for y, denoted ŷ, can be calculated by keying in a proposed value for x and
pressing ´ j.
An Estimated value for x (denoted ) can be calculated as follows:
1. Press ´ L.
2. Key in the known y-value.
3. Press ® - ® ÷.
Correlation Coefficient. Both linear regression and linear estimation
presume that the relationship between the x and y data values can be
approximated by a linear function. The correlation coefficient, r, is a
determination of how closely your data fit a straight line. The range is
−1 ≤ r ≤ 1, with −1 representing a perfectly negative correlation and +1
representing a perfectly positive correlation.
Note that if you do not key in a value for x before executing ´ j, the
number previously in the X-register will be used (usually yielding a
meaningless value for ŷ).
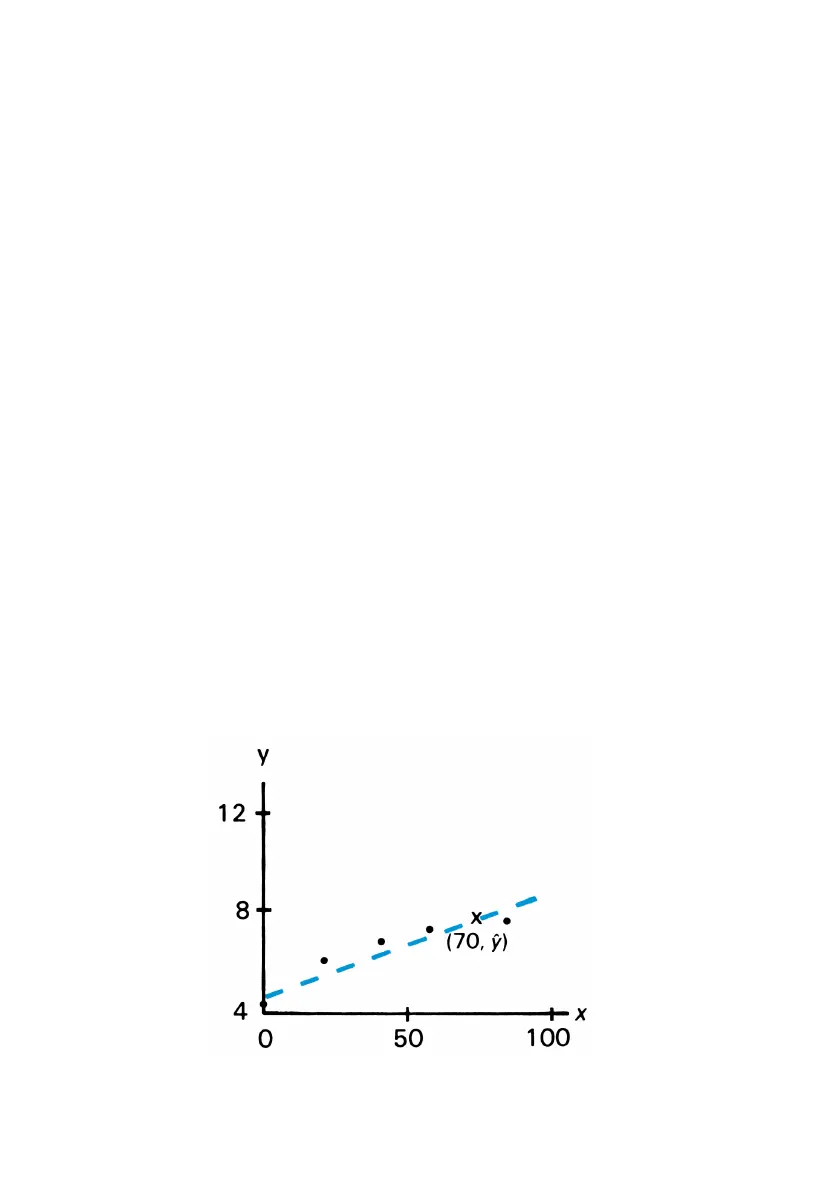
Example: What if 70 kg of nitrogen fertilizer were applied to the rice field?
Predict the grain yield based on Farmer’s accumulated statistics. Because
the correlation coefficient is automatically included in the calculation, you
can view how closely the data fit a straight line by pressing ® after
the y prediction appears in the display.
 Loading...