10-10 Statistics aplet
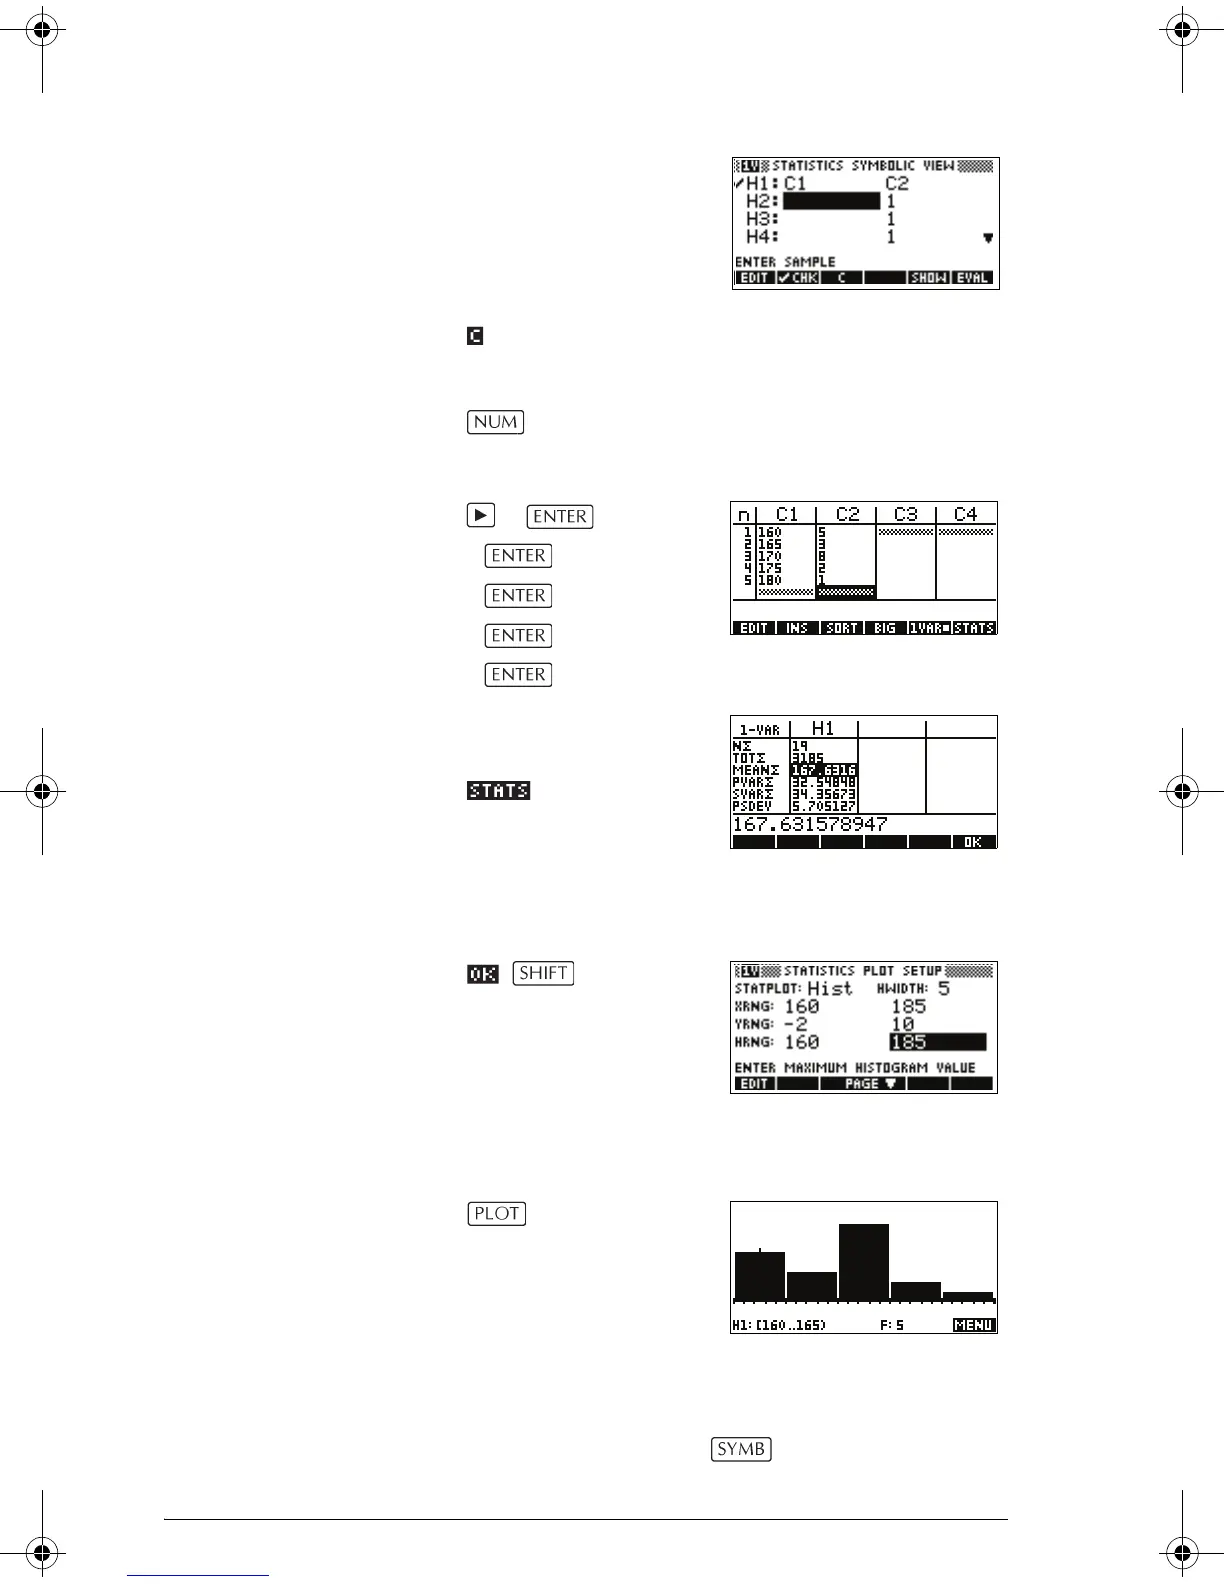
5. Move the highlight bar
into the right column of
the H1 definition and
replace the frequency
value of 1 with the
name C2.
2
6. Return to the numeric view.
7. Enter the frequency data shown in the above table.
5
3
8
2
1
8. Display the computed
statistics.
The mean height is
approximately
167.63cm.
9. Setup a histogram plot for the data.
SETUP-PLOT
Enter set up information
appropriate to your
data.
10.Plot a histogram of the data.
Save data The data that you enter is automatically saved. When you
are finished entering data values, you can press a key for
another Statistics view (like ), or you can switch to
another aplet or HOME.
hp40g+.book Page 10 Friday, December 9, 2005 12:27 AM
 Loading...