I
-
-
Using Instrument Functions
Printing and Plotting Measurement Results
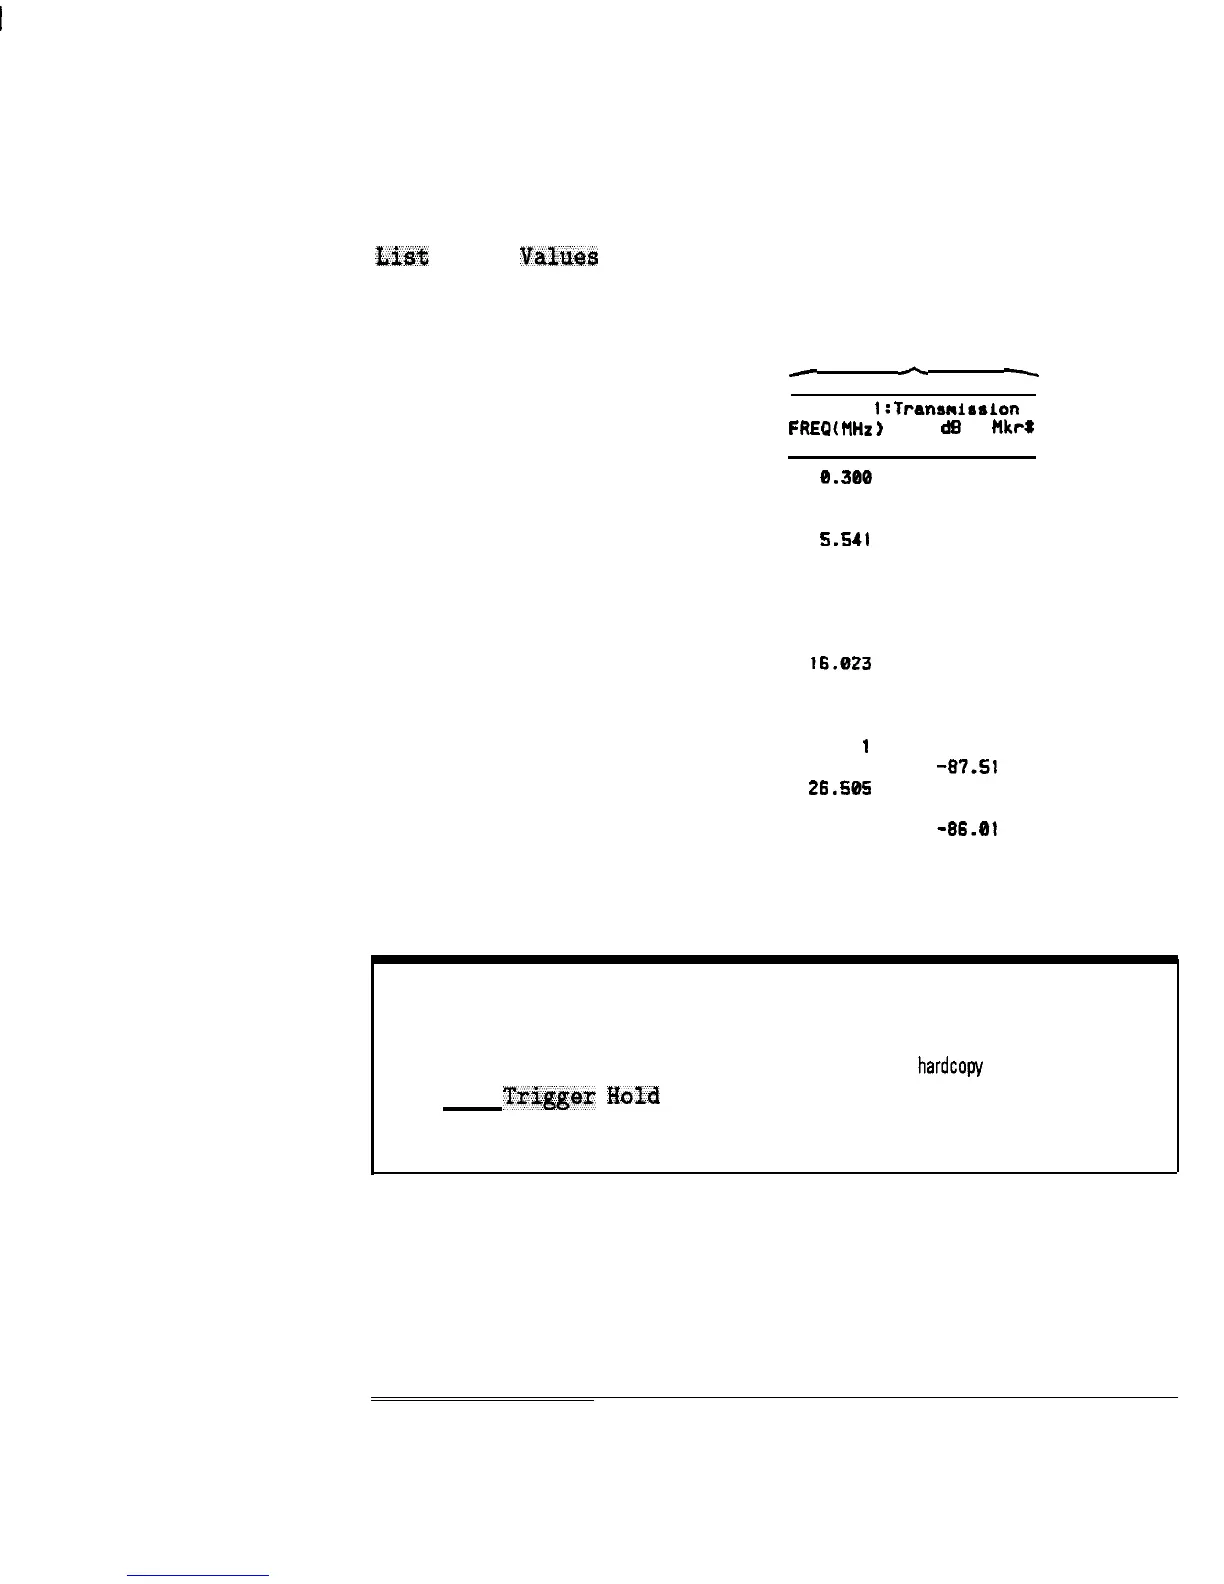
Lit%
Tram
Values
outputs a list of the data trace point values. (This
selection is only available for output to a printer.)
Trace Values
-
A
-
CHANNEL
1:Transni~slon
FREQ(
HHz
)
dB
Hkrlr
8.300
-47.01
2.047
-66.92
3.794
-71.87
5.541
-76.94
7.288
-82.18
9.035
-89.23
10.782 -77.77
12.529
-82.95
14.276 -89.84
16.023
-85.46
17.770
-79.86
19.517 -88.07
21.264
-80.75
23.01
I
-83.53
24.758
-87.51
26.505
-84.91
28.252
-83.51
29.999
-86.0t
Figure 4-27. Trace list Values
NOTE
You may notice a decrease in measurement speed when the network analyzer is outputting to a printer
or plotter that doesn’t have a built-in buffer. For the fastest possible
hardcopY
dump to such devices,
press (MENU)
Trig&w
H&d
before beginning the print or plot. Refer to the following table
for some typical print times.
4-91
深圳市盛腾仪器仪表有限公司 Tel:0755-83589391 Fax:0755-83539691 Website: www.Sengt.com
 Loading...