Specifications and Characteristics
Instrument Specifications and Characteristics
Typical
Measurement
Uncertainty
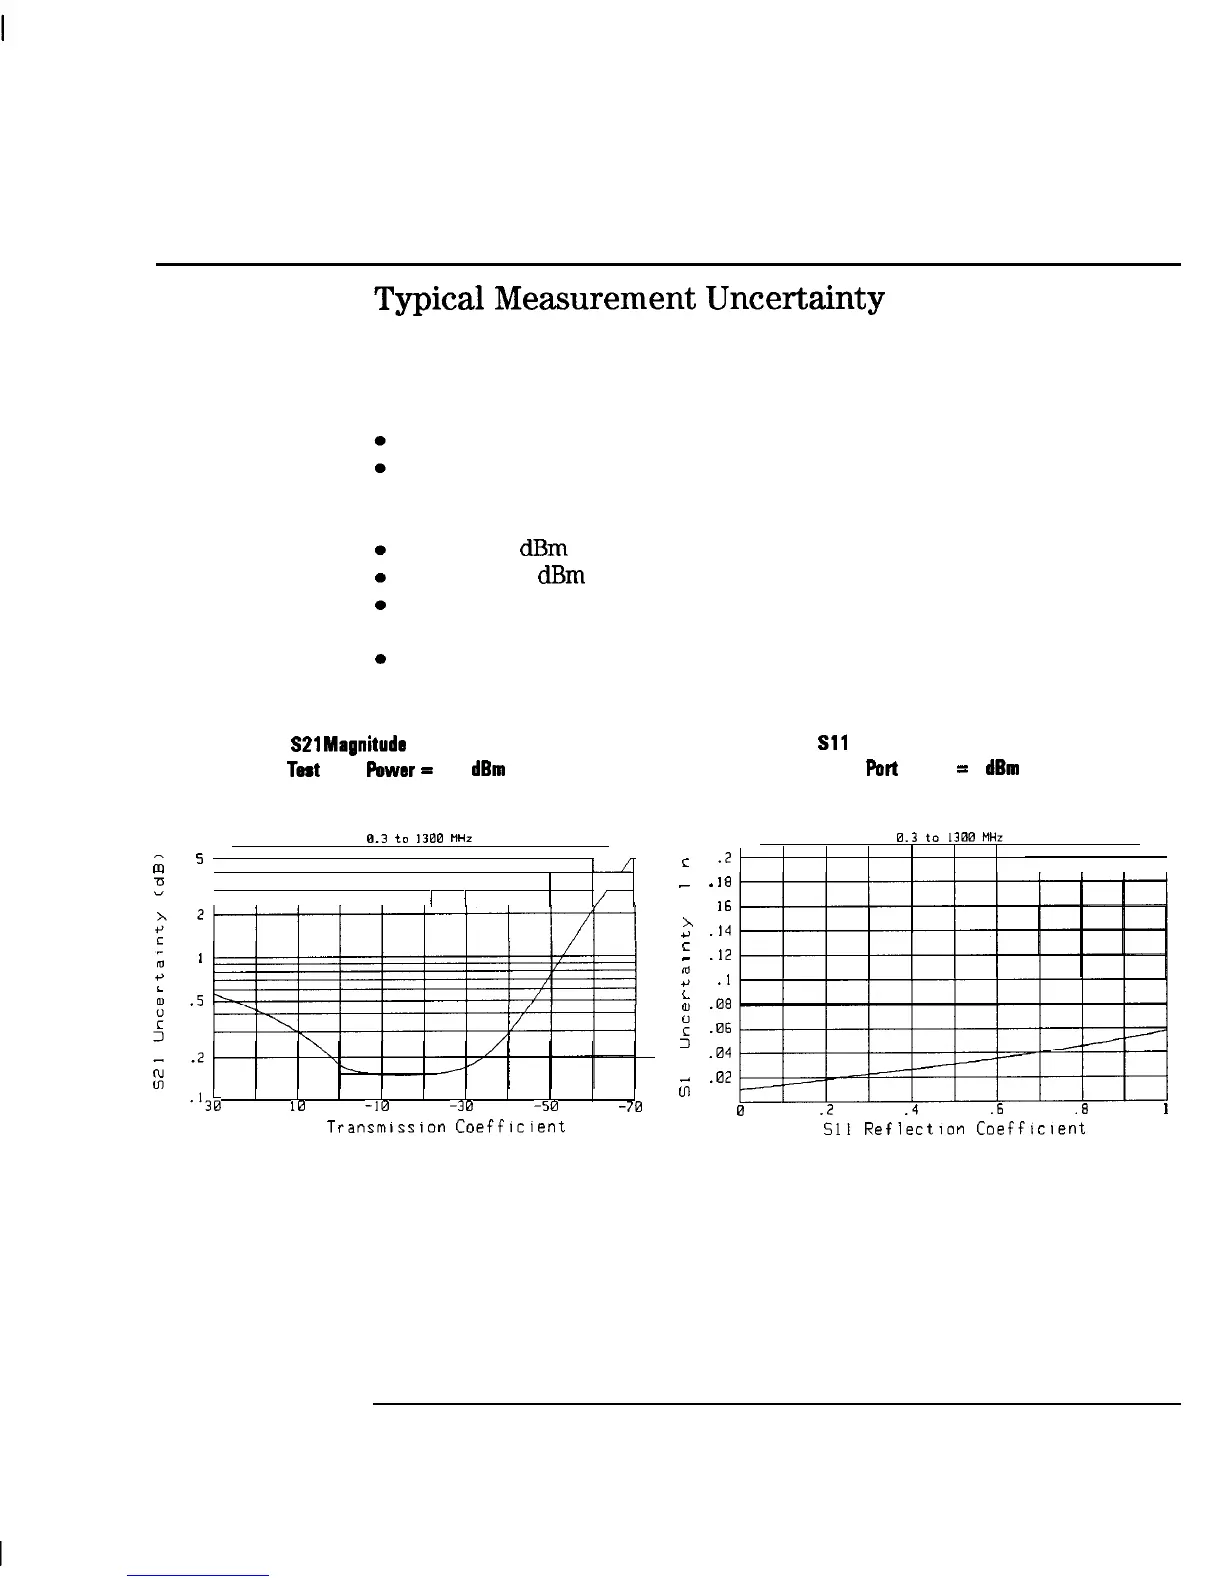
The following graphs show typical measurement uncertainty. The
assumptions made to generate these curves were:
For transmission uncertainty, the DUT is assumed to be well-matched.
For reflection uncertainty, the DUT is assumed to be a one port device. (In
other words, load match errors produced when measuring transmission are
not taken into account.)
Power = 0
dBm
for reflection measurements
Power = -20
dBm
for transmission measurements
For transmission measurements, an enhanced response calibration was
performed.
For reflection measurements, a one port calibration was performed.
S21
Malnitudr Uncertainty
Taat
part
Power
=
-20
dBm
HP 87 11 C Uncertainty Curves
Sll
Magnitude Uncertainty
Tast
Port
Power
=
0
dBm
8.3
to
,380
flHZ
5
I III II
I
I
I/
I I I I
I
I
I
/
c
.2
-
.
18
x
16
*
.14
c
I
-
.12
r(l
+J
.I
.5
L
:
.08
:
.06
.04
.‘30
I0
-10
-30
-50
521
Transmlsslon
Coefflclent
-70
d
.02
ul
0
I I I
I
0
.2
.4
.6
.8
I
Sll
ReflectIon
Coefficient
10-11
I-
深圳市盛腾仪器仪表有限公司 Tel:0755-83589391 Fax:0755-83539691 Website: www.Sengt.com
 Loading...