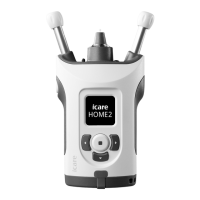
39
from the tonometer. The measurement data can still be found from the
tonometer memory and transferred once the connection is re-established.
Failure or misconfiguration of the IT network may result in data not being
transferred.
17.6 Required characteristics of the IT network
The responsible organization is strongly recommended to maintain virus
protection up to date on the computers and mobile devices used. The
responsible organization is also recommended to install security updates to
the used web browsers, computers, and mobile devices when available.
1 7.7 Performance data
1 7.7.1 Clinical performance data
A clinical study was conducted to analyze the variability of the intraocular
pressure (IOP) self-measurements with the iCare HOME2 tonometer in
comparison to the variability of the IOP measurements with the reference
tonometer (iCare IC200, ANSI Z80.10-2014 compliant) over a wide range of
IOP measurement values.
The performance data was obtained from a clinical study. The study was
performed at East West Eye Institute, CA 90013, USA, and included 47
patients. All patients were found to be eligible for analysis. All the patients
were either diagnosed glaucoma patients or ‘glaucoma-suspects’. A random
eye was selected as the study eye for each patient.
Safety: No adverse events (including corneal abrasions) were recorded in
the study population.
Results: The mean paired difference and standard deviation (iCare HOME2 -
iCare IC200) were 0.55 mmHg and 2.69 mmHg.
The iCare HOME2’s variability (difference of repeat measurements) for each
patient was ~7.9% for all the IOP ranges.
Summary of study results (sitting and supine positions)
Group N
HOME2 Reference,
IC200
Difference 95% CI
for Mean
Difference
95% LOA
for Mean
DifferenceMean (SD) Mean (SD) Mean (SD)
≤ 16 mmHg 24 15.78
(2.86)
14.86
(2.9)
-0.93
(2.75)
-1.38, -0.48 -6.32, 4.46
>16 to <23
mmHg
13 20.17
(2.28)
19.56
(2.75)
-0.6
(2.66)
-1.2, -0.00 -5.81, 4.61
≥ 23 mmHg 10 23.88
(2.34)
24.33
(2.42)
0.44
(2.36)
-0.17, 1.05 -4.19, 5.07
Overall 47 18.72
(4.17)
18.17
(4.67)
0.55
(2.69)
-0.86, -0.23 -5.82, 4.72
PRECAUTION! Please be advised that the measurement results may vary between an
IOP self-measurement and an IOP measurement performed by a healthcare
professional.
In a clinical trial, the mean difference between the measurements performed by a
healthcare professional and an IOP self-measurement was -1.45 mmHg for sitting
position and 0.71 mmHg for supine position. The overall mean difference between self-
measured IOP values and healthcare professional measured IOP values was 0.55 mmHg.