Vector Function
Copyright ©ITECH Electronic Co., Ltd. 58
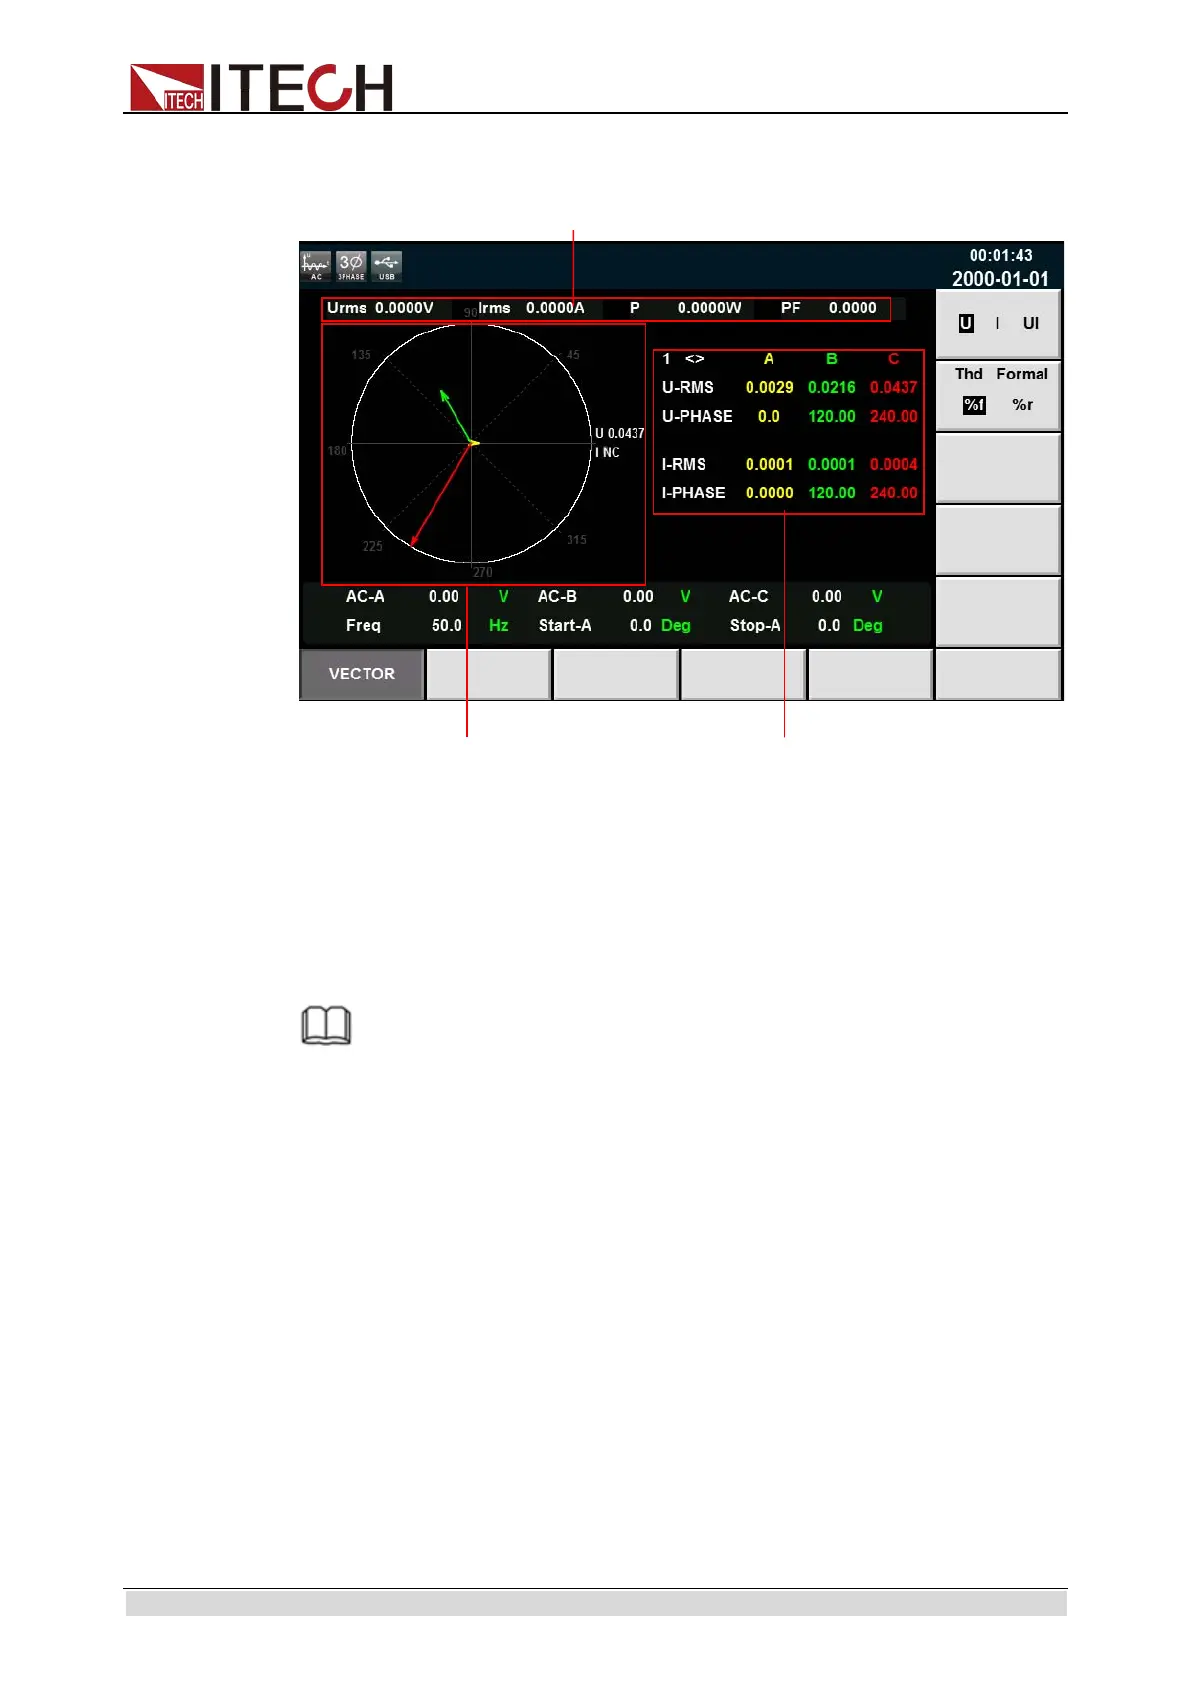
Introduction to vector display interface
Coordinate of maximum value: display the maximum U, I or UI values of the
phases A, B and C.
Vector value of single harmonic phase: display the single harmonic component
and phase value of each phase. The phases A, B and C are respectively in
yellow, green and red. The user can rotate the knob to select the desired single
harmonics.
NOTE
The vector function is valid only in the three-phase mode.
The phase parameters in the figure correspond to those in the harmonic
function. The vector diagram is another kind of demonstration of
parameters in the harmonic function.
harmonic phase
Coordinate of
maximum value
ООО "Техэнком" Контрольно-измерительные приборы и оборудование www.tehencom.com