805.83
K-Commander Loss-in-Weight Programming
Rev: G Produced by the K-Tron Institute
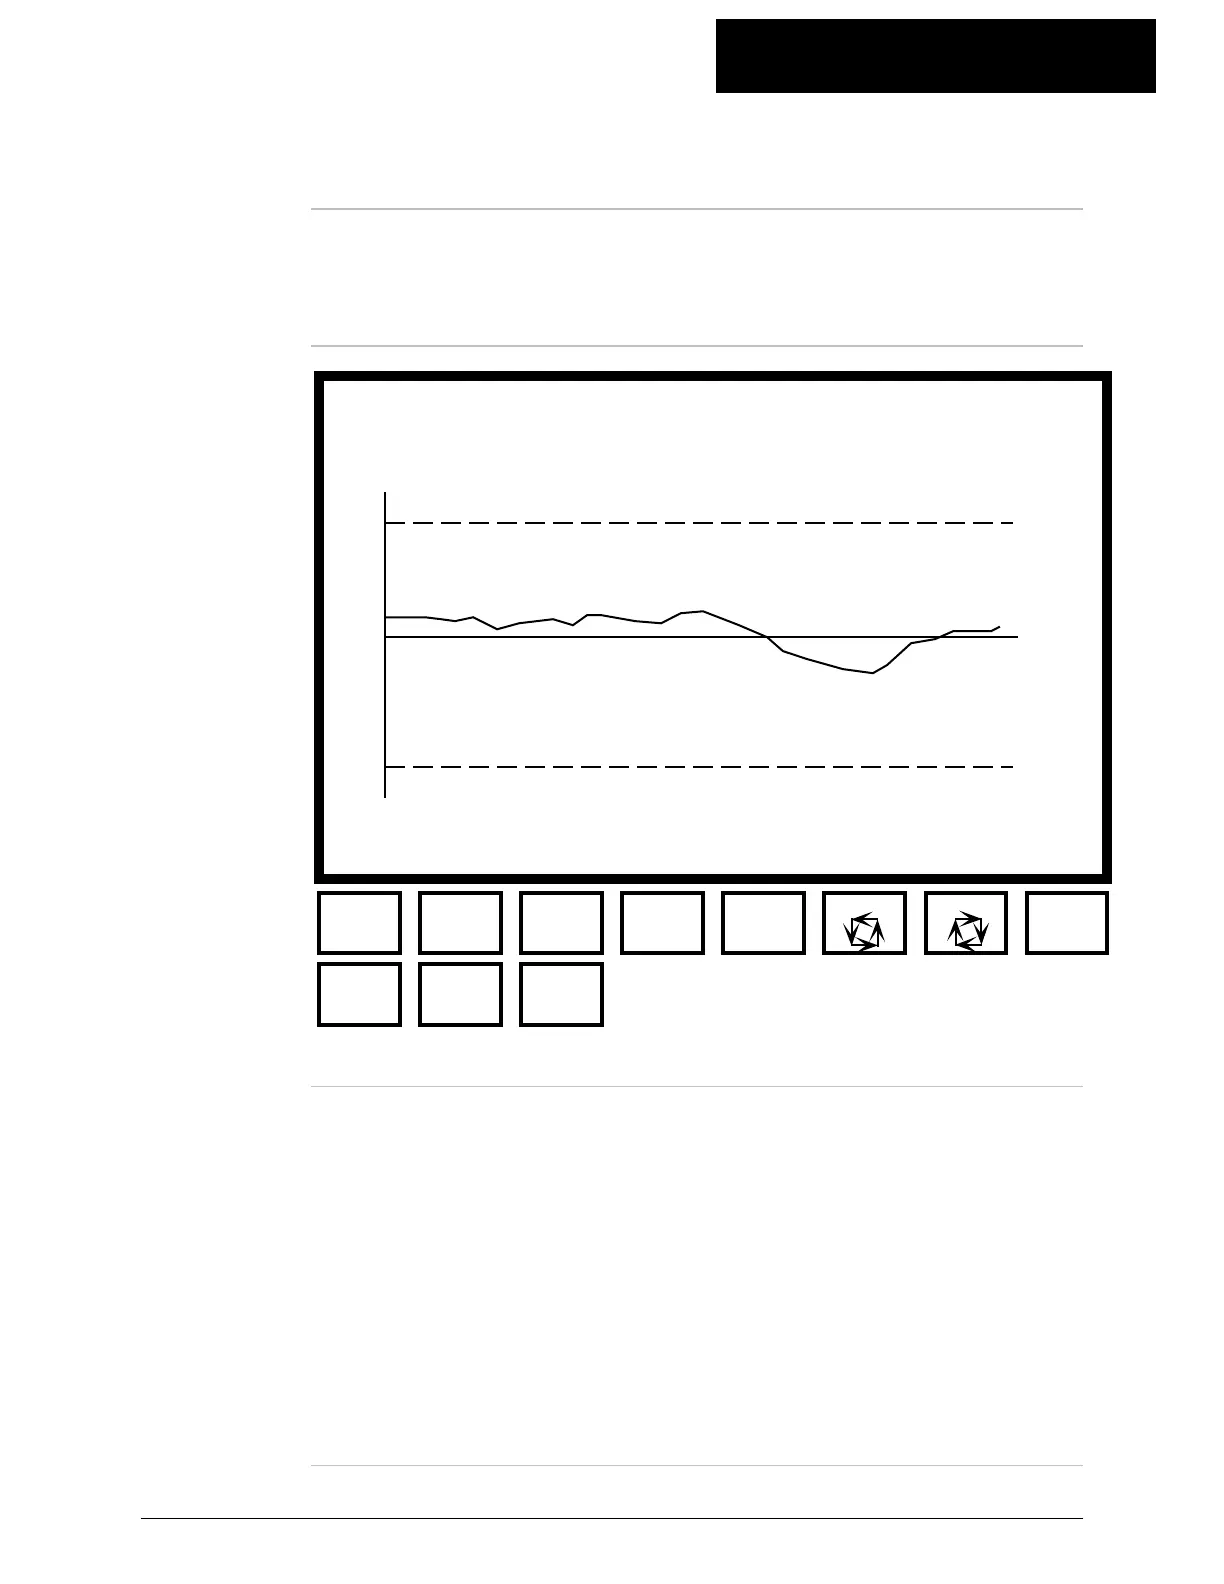
LWF Page 12: SPC Chart
Introduction
Page 12
This page provides charting of selected variables, one at a time selected
from page 11 of the controller.
Page 12 layout
F6 F7
F1
Move
Backward
POWDER LWF : SPC Chart M01.12
F2
Move
Forward
F3
Zoom
In
F4
Zoom
Out
F5
End of Log
Add Pt
F8
More
Keys
F1
Start
of Log
F2
End Log
Add New
F3
Cycle
Snapshots
Basics of SPC
operation
Each point indicated on the chart is an average of the number of
samples of the selected variable specified by the sample width
parameter set on pg Mcn.11. Samples are taken every two seconds. The
amplitude of the points on the chart (in pixels) is equal to:
Amplitude = 2000*(chart scaling factor)* Deviation from target
where chart scaling factor is set on page Mcn.11.
The height of the chart between zero deviation and either dashed line is
100 pixels.
Continued on next page