Keysight N9927-90001 User’s Guide 281
IQ Analyzer (IQA) – Option 351 (CPU2 Only)
Alignments
Alignments
The IQA mode requires all three alignment types: amplitude, RF burst, and
channel equalization. Refer to the SA chapter’s “Alignments” on page 180 for
information on all alignments.
Trace Display States (IQA Mode)
In IQA Mode you can display up to four of the following types of trace states.
All IQA settings are applied to all displayed traces. See also “Marker Trace (IQA
and SA Mode)” on page 602.
A color-coded legend for displayed traces is visible in the left pane of the SA
mode screen:
W = Clear/Write; M = MaxHold; m = MinHold; A = Average; V = View
How to display the Trace States
—Press Trace 6.
—Then Trace 1,2,3,4
repeatedly to select a trace number to display or change
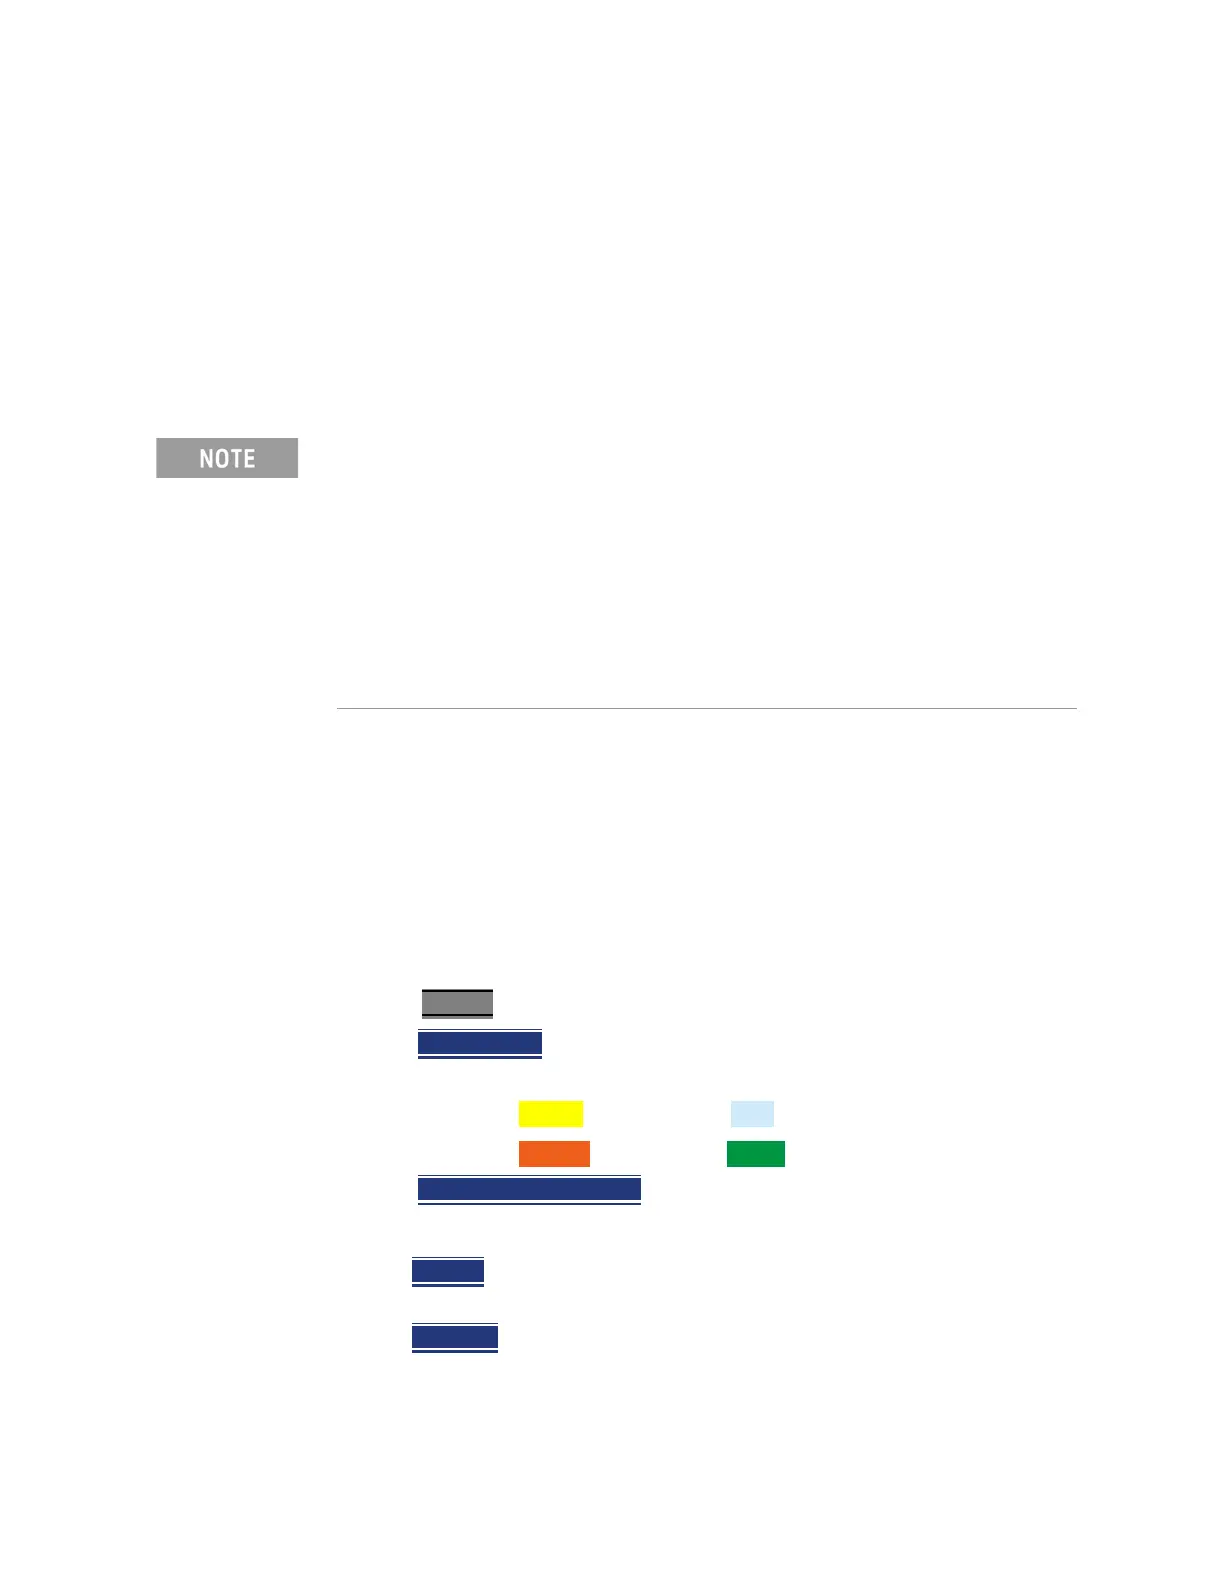
its state. Traces are displayed in the following colors:
—Trace 1 – Yellow Trace 2 – Blue
—Trace 3 – Orange Trace 4 – Green
—Then State [current setting]
— Then choose from the following Trace States:
—Clr /Wr
(Clear/Write) Displays the actual measured data for each
acquisition.
—MaxHold
Displays the maximum response of the input signal at each
data point over multiple acquisitions. See also Average Count in
“Adjusting the Measurement Setup Settings” on page 270.
If you have Option 351 I/Q Analyzer option, you can directly save your data as
MATLAB files (*.mat). Refer to Chapter 11, “IQ Analyzer (IQA) – Option 351
(CPU2 Only)”, on page 257 and to Chapter 31, “File Management.”
If you have the FieldFox’s Remote Server mode (89600 VSA software
connectivity), you can use the VSA software to capture and record your
data as MATLAB files (*.mat). Learn more about FieldFox and 89600 VSA
software, refer to Chapter 16, “Remote Server Mode (Requires CPU2 and
SA Hardware/SA Option 233)” and to
http://rfmw.em.keysight.com/wireless/helpfiles/89600B/WebHelp/89600
.htm.