39
SW 3400-103: Measurement Recorder
Select menu: Parameter setting/Module FRONT/Measurement recorder
The last 200 data records are stored in the analyzer and are represented
graphically – like on a recorder. All further data can be stored on the
SmartMedia card and be evaluated by a computer.
2 process variables are represented. You can configure:
• The process variable to be displayed
• Start and end value for the variable to be recorded
• Time base (recording interval, selectable from 10 s to 10 h)
In addition, the time axis can be stretched by factor 10 using the ”zoom”
function. In the event of quick changes, the zoom function is automatically
activated. It always starts several pixels before the event. This allows detailed
investigation of signal instabilities.
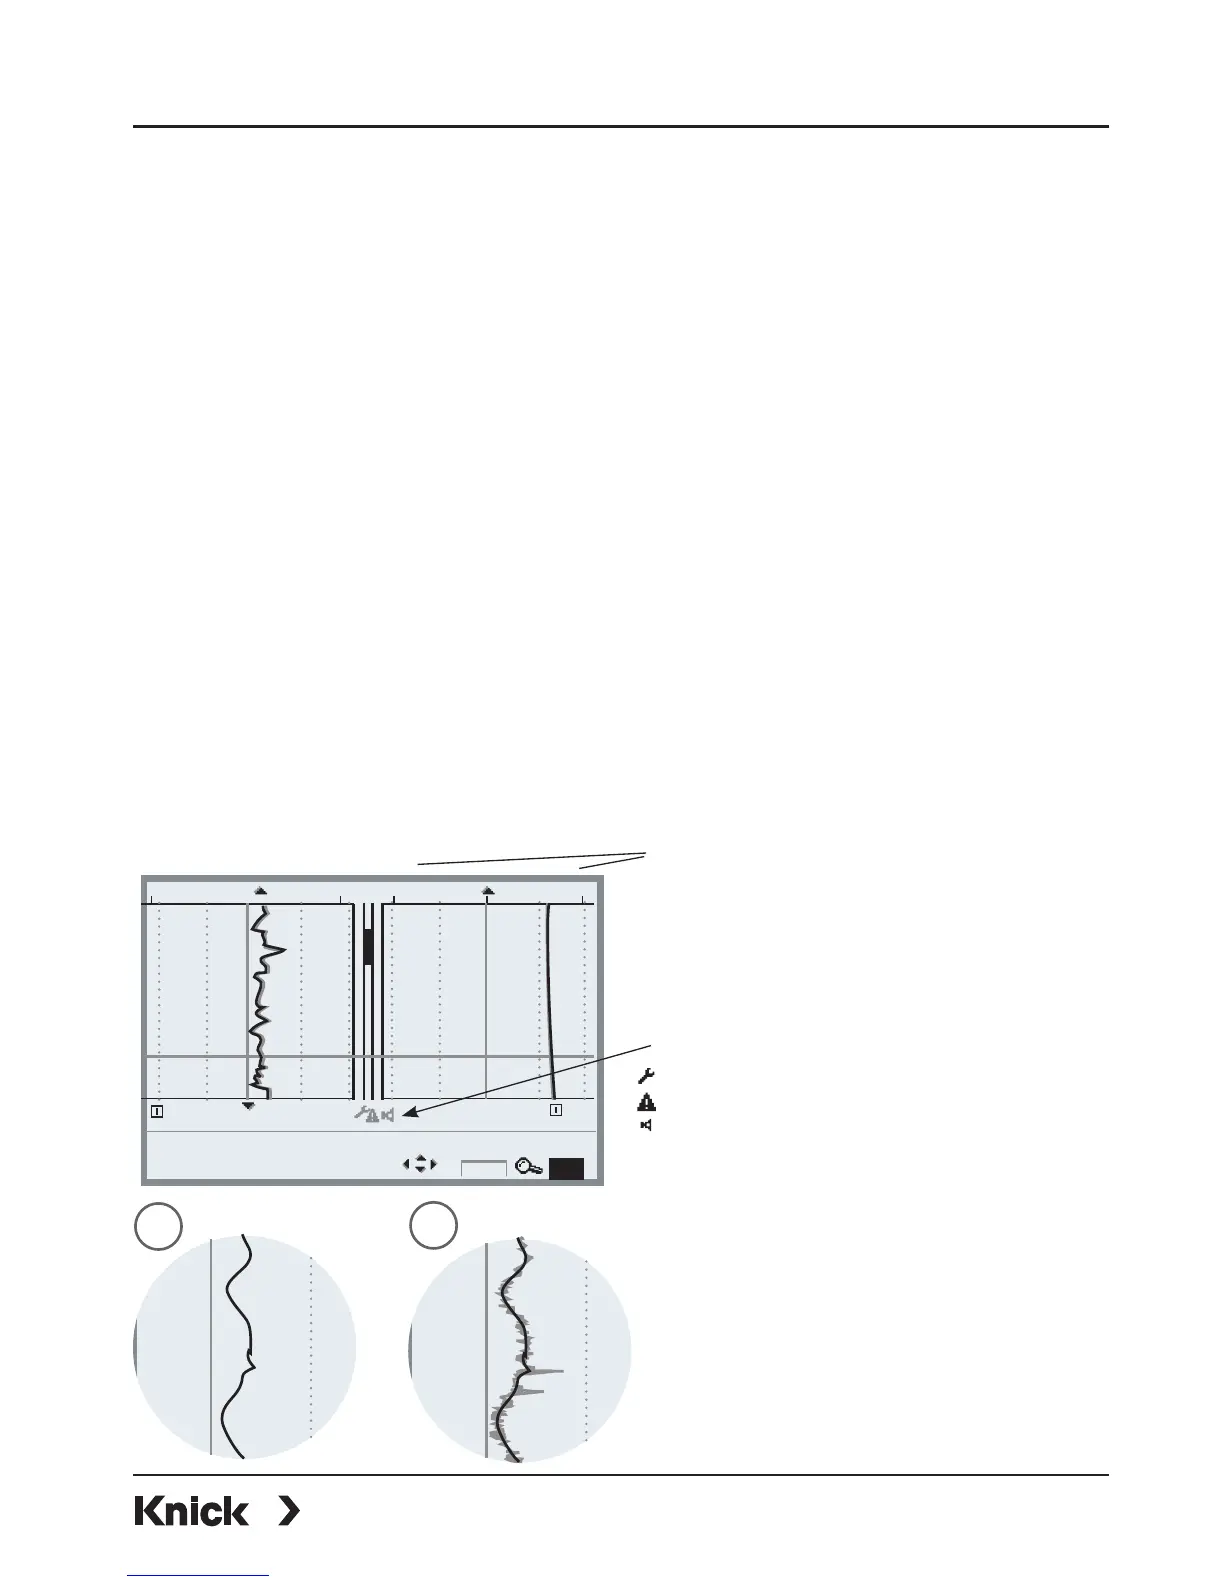
With “Min/Max displays” activated, the respectively measured peak values
(gray) are shown in addition to the measured value (average).
Min/Max display
The minimum and maximum values
within the recording interval are
shown as a gray line next to the
(averaged) measured value.
Fig. 1: Min/Max off
Fig. 2: Min/Max display
Graphic range
Start and end value of the
process variable
1
2
Events (NAMUR) (see “Info”)
Maintenance request
HOLD (function check)
Failure
25°C0.004 mS/cm 20°C
0.002mS/cm
S/cm
07/22/10 12:31:11, Status: Measurement
0.003mS/cm, 23.9°C
°C
Info
10x