LAUNCH X-431TOP User’s Manual
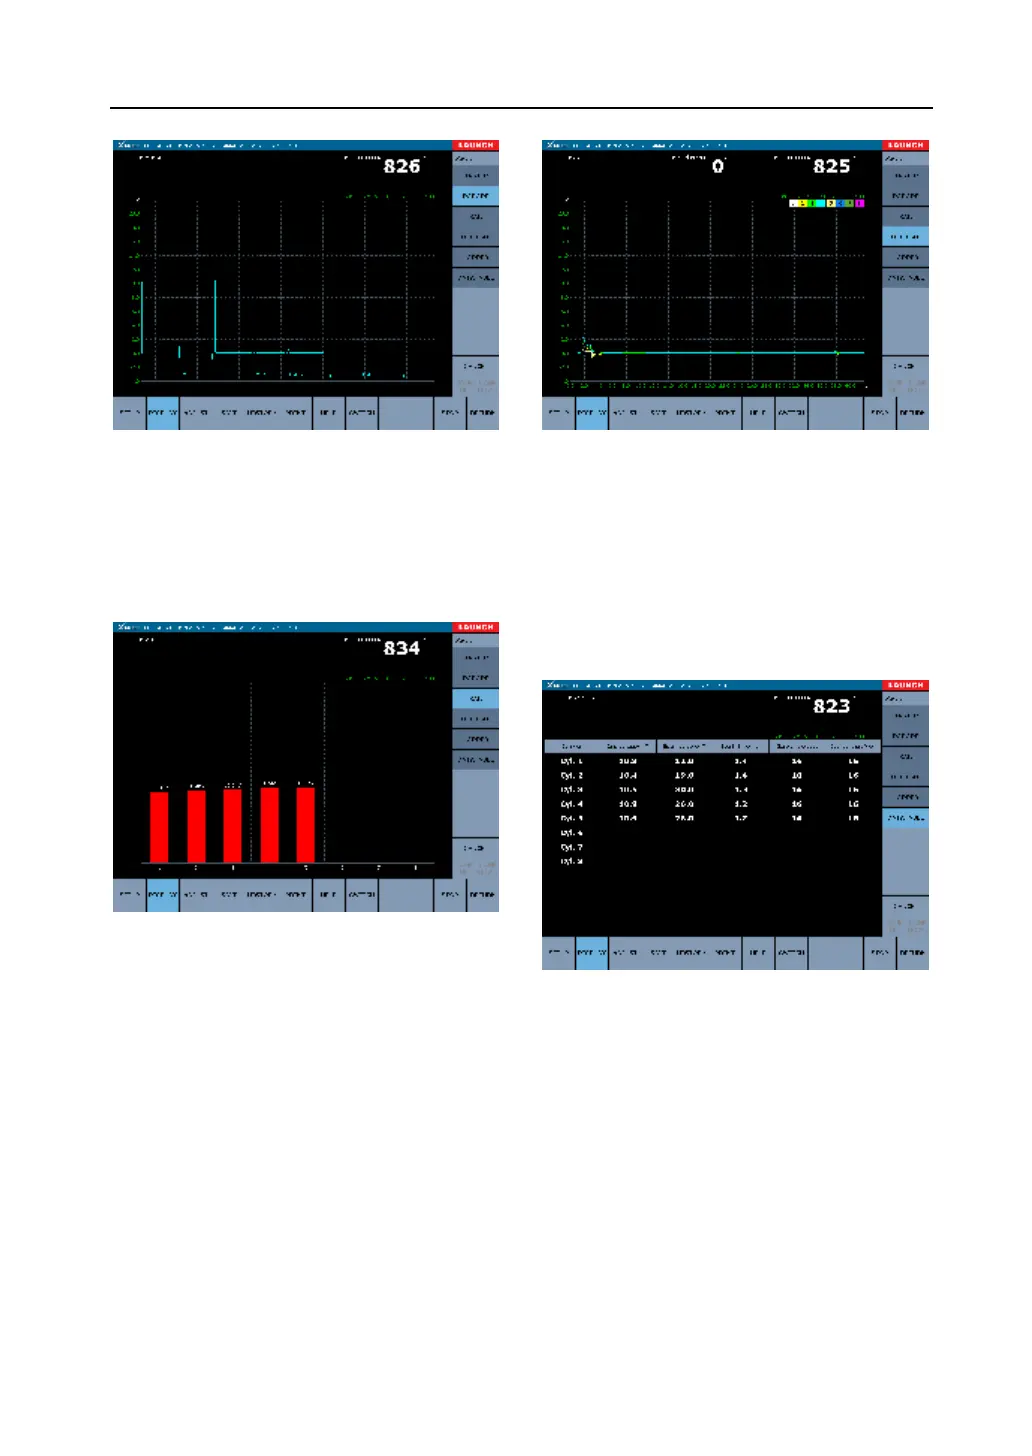
Fig. 3-23
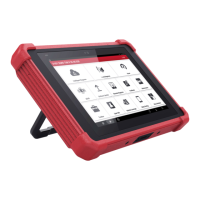
Bar Graph
Fig 3-24 shows the bar graph.
Fig. 3-24
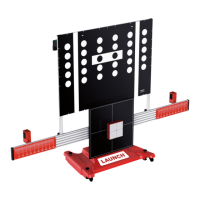
Overlap Pattern
Fig 3-25 shows the overlap pattern.
Fig. 3-25
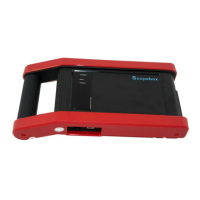
Data Table
Fig 3-25 shows the data table. It displays the
data of ignition breakdown voltage, spark voltage,
spark time, close angle and overlapping angle in
data table.
Fig. 3-26
Display Waveform Adjustment
Click “adjust” in “ignition analysis” mask
(distributor, independent or simultaneous mask)
to enter the “adjust” interface. (See fig 3-27).