WEIVER 2.0 Manual
Weiver 2.0
/ Operations Manual
50
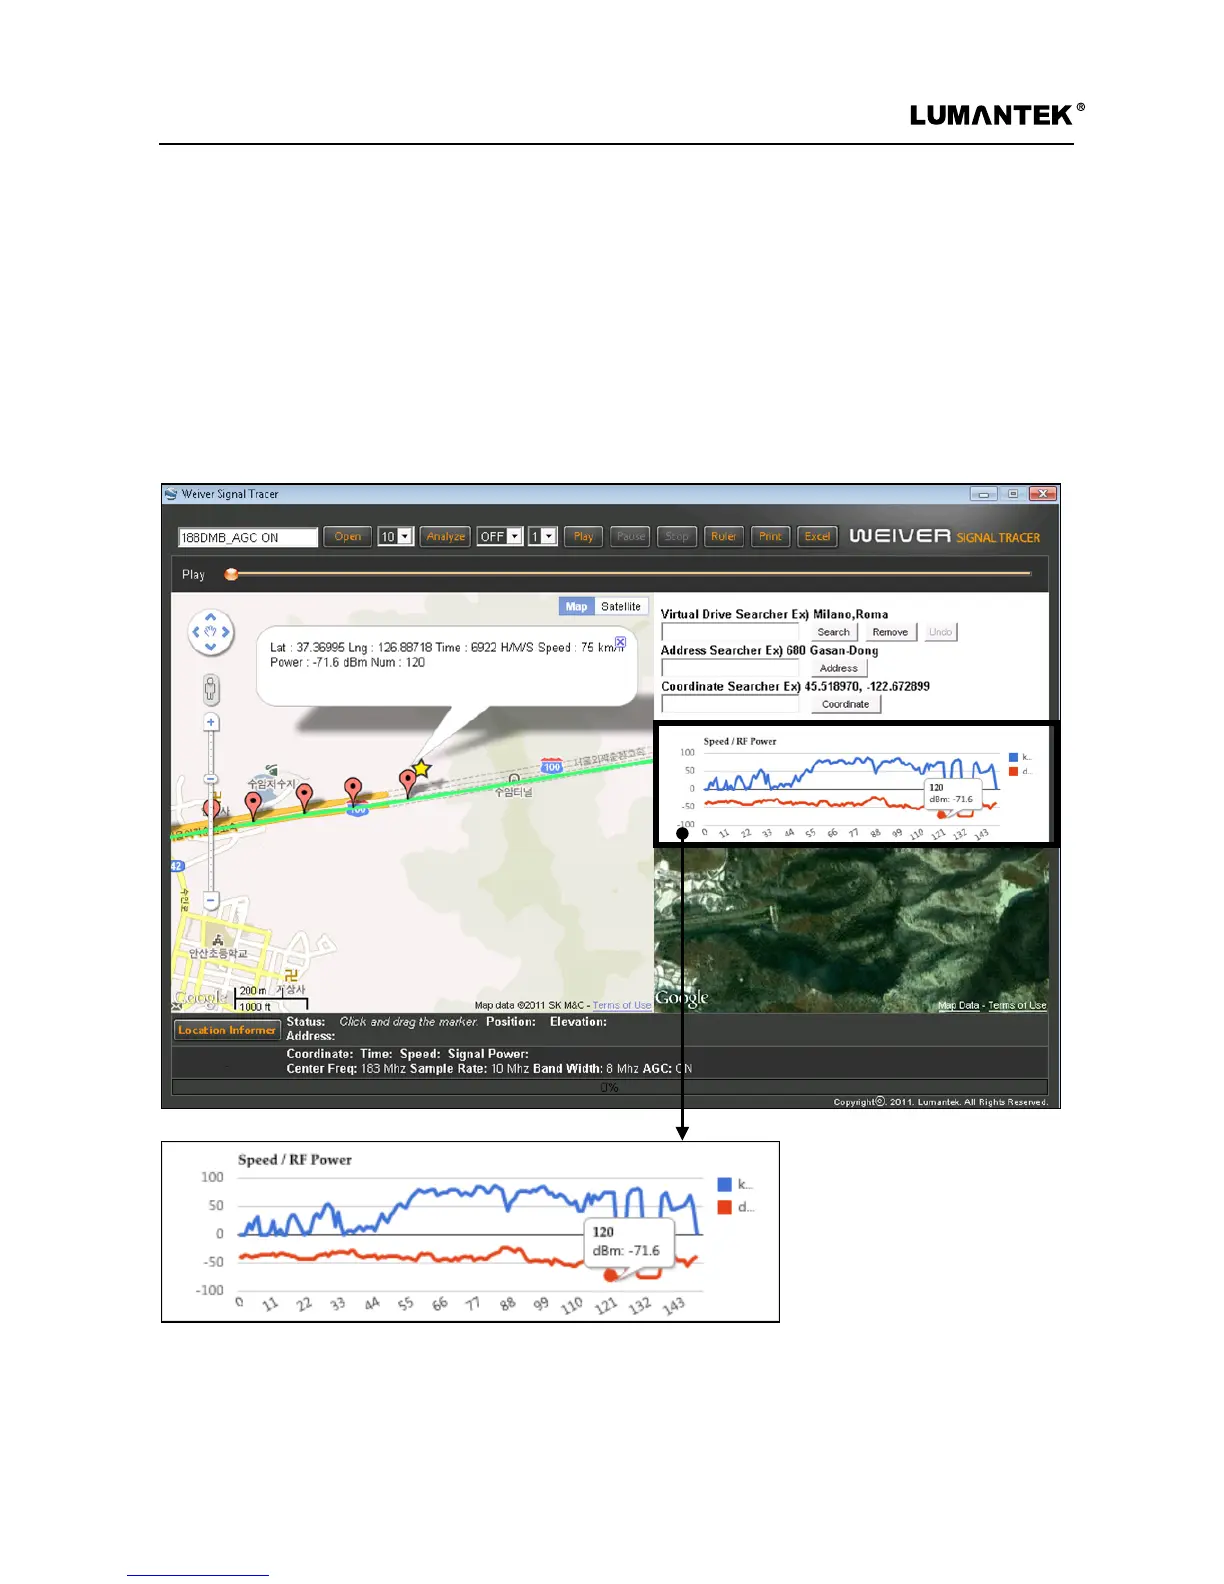
Chart window displays after analyze. The blue-colored graph is for a velocity of the vehicle and the red-
colored graph is for RF signal’s power. According to the chart in the above, the signal sharply dropped in two
times, approaching mouse pointer to these points makes information of each point indicate at the note.
Clicking the note allows it to move the corresponding location in the map (In the tunnel, GPS coordinates
cannot be received, therefore clicking any points of tunnel leads to display the latest GPS coordinates).
Chart Window
 Loading...