WEIVER 2.0 Manual
Weiver 2.0
/ Operations Manual
37
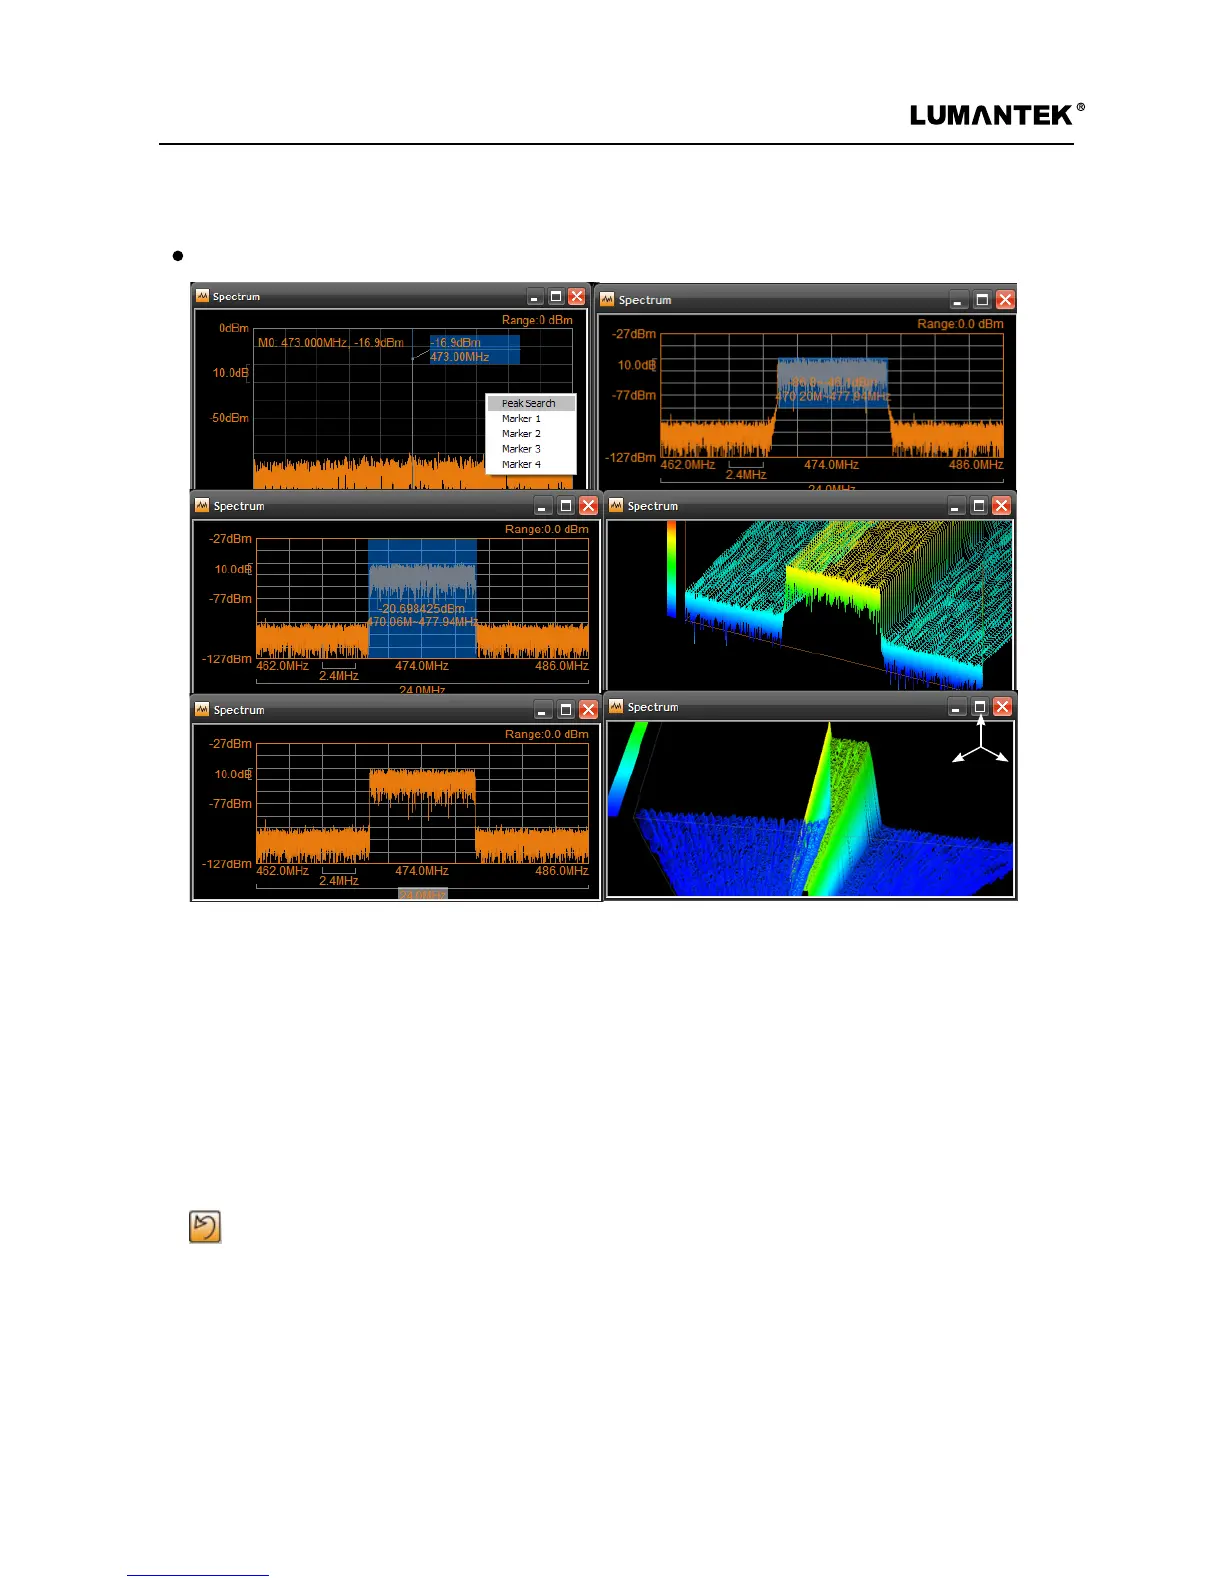
Analyzer
-3D Spectrum
Within Spectrum View, the spectrum can be displayed in a simulated 3D style. 3D graph can be controled with
mouse control in a perspective way.
-2D Spectrum
By default, the spectrum is displayed as 2D style. The Complex FFT Spectrum will display captured 8M
bandwidth and captured 24M, 48M and 56M bandwidth.
-Zoom Mode
In the Spectrum View, the Zoom In feature can be used. To return to the initial non-zoomed state use Undo
, or press the key, Ctrl +Z.
-Marker Mode
The Marker feature can be used to measure power of the RF signal.
-Band Power Mode
In the Spectrum View, drag your mouse to the desired Band Power Range to see the respective measurement.
mouse control in perspective
 Loading...