Operation Manual
touchTymp MI 26
and
MI 36
Version
Also, check-out our training videos:
MAICO Training | touchTymp Part 1 | 5/8 Acoustic Reflexes - YouTube
https://www.youtube.com/watch?v=g0PA5TtkBsQ&list=PLonI5JzuDcd7lxKobEy7BW3DS59QCsbAG
&index=5
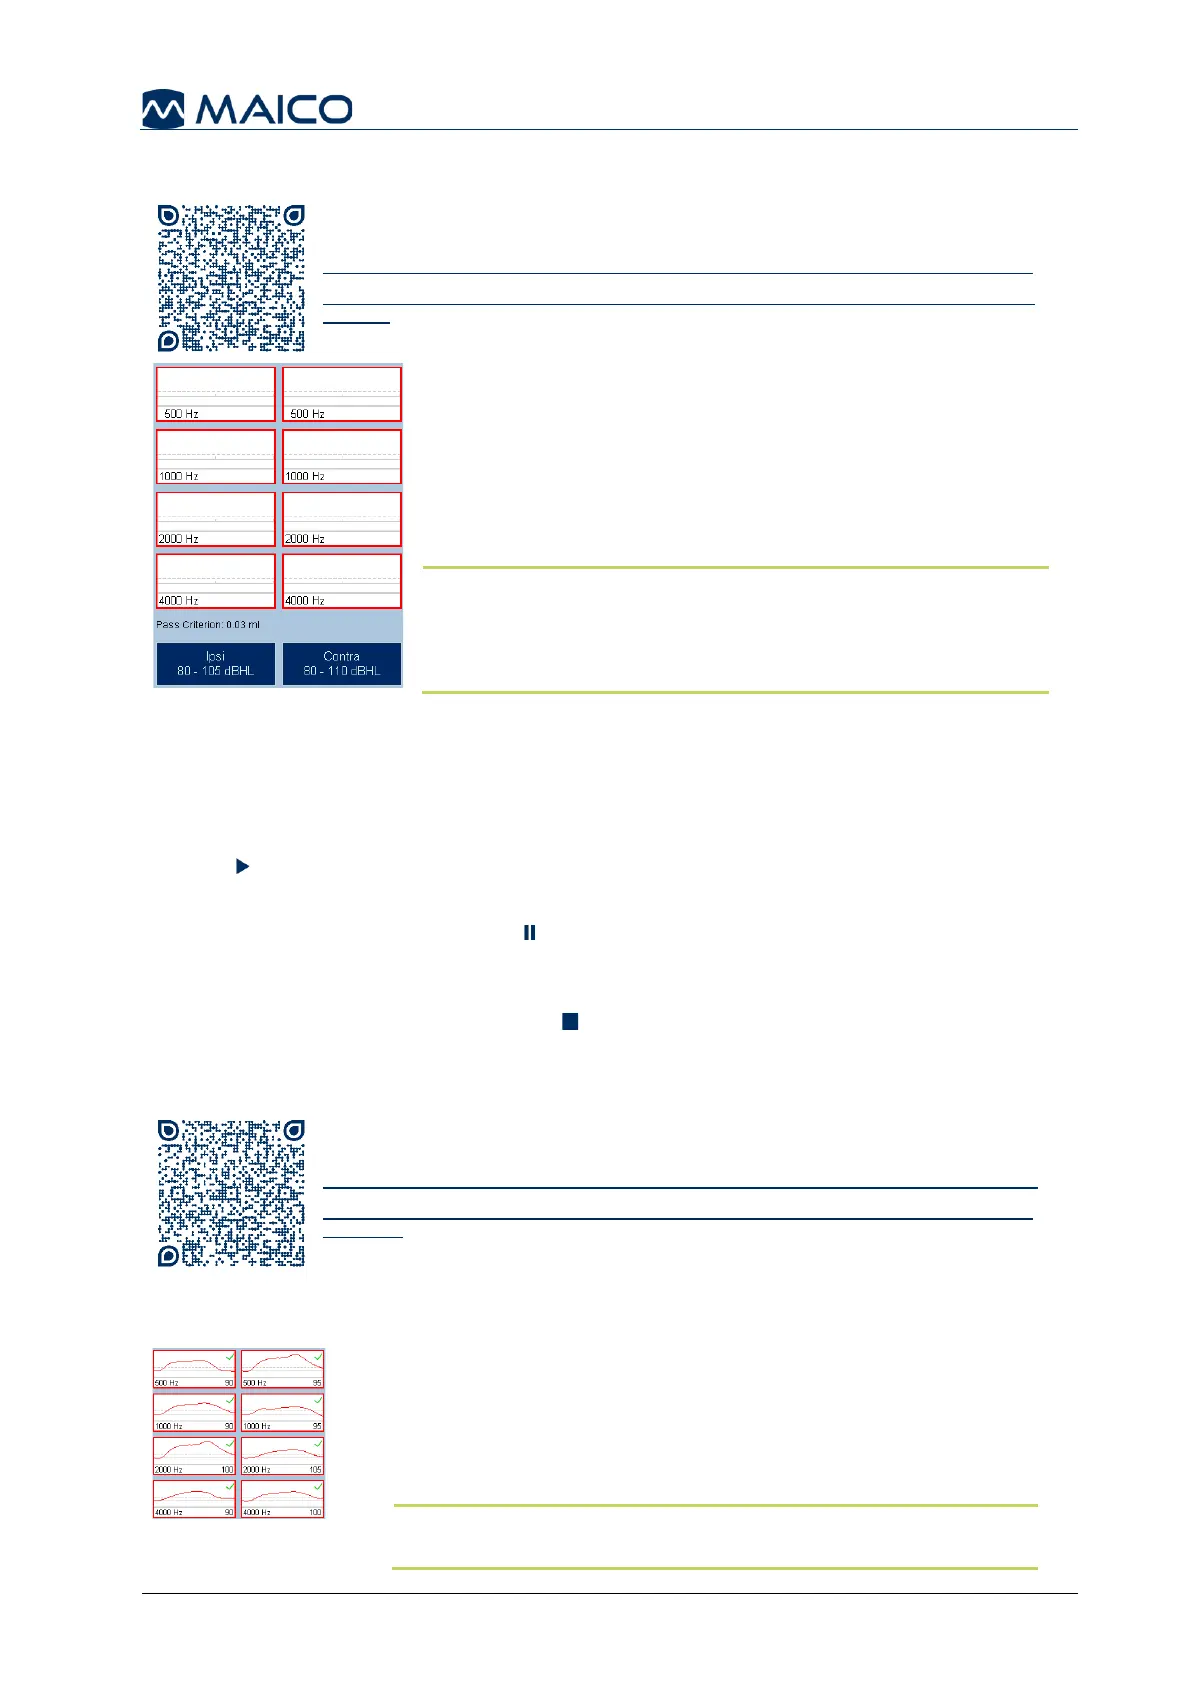
The screen (Figure 47) shows the buttons for Ipsi and
Contra as well as the different frequency buttons. They are
always presented according to the default settings in the
setting menu and from low to high frequencies. It is possible
to select or deselect one of the frequencies by pressing on it.
Pressing the Ipsi or Contra button will turn on/off all
frequencies or set the selection back to default settings.
NOTE: If there are no frequencies chosen in the default
settings it is not possible to turn on an Acoustic Reflex
test by pressing the Ipsi or Contra button. To turn on a
Reflex, press the individual frequency to be tested.
The Ipsi and Contra button also show the level range (for
automatic level adjustment) or the level (for fixed levels).
See section 5.6.10.
The measurement starts when the probe is properly placed in the ear (when in the Basic
Settings menu the automatic start of the measurement is selected (see section 5.6.3) or
the Play button is pressed (when the manual start of the measurement is selected).
When performing Acoustic Reflex testing it is possible to interrupt the measurement
for pausing by pressing the Pause button, the Probe button (both only possible in
manual mode) or removing the probe from the ear (no seal state). While having the
probe removed from the ear the display will show a message box asking if you want to
stop the measurement. Press Stop to stop the measurement. Continue the
measurement by inserting the probe into the ear again.
Evaluation
Also, check-out our training videos:
MAICO Training | touchTymp Part 1 | 6/8 Acoustic reflex result - YouTube
https://www.youtube.com/watch?v=FbQ5Zk1SGdM&list=PLonI5JzuDcd7lxKobEy7BW3DS59QCsbA
G&index=6
The evaluation of the Acoustic Reflex test results depends on the configuration
displayed as a graph or table.
Graph: The measured curves are displayed simultaneously
to the ongoing test. For easier evaluation the pass criterion
threshold and the zero line are shown in the graph.
Underneath each diagram the frequency and the intensity
level in dB
HL are displayed (Figure 48).
NOTE: The deflection of the graph can be modified in the
settings. See section 5.6.9.
 Loading...