Service Manual SM-MDS_(ii) 41
4.6.2 Service Monitor
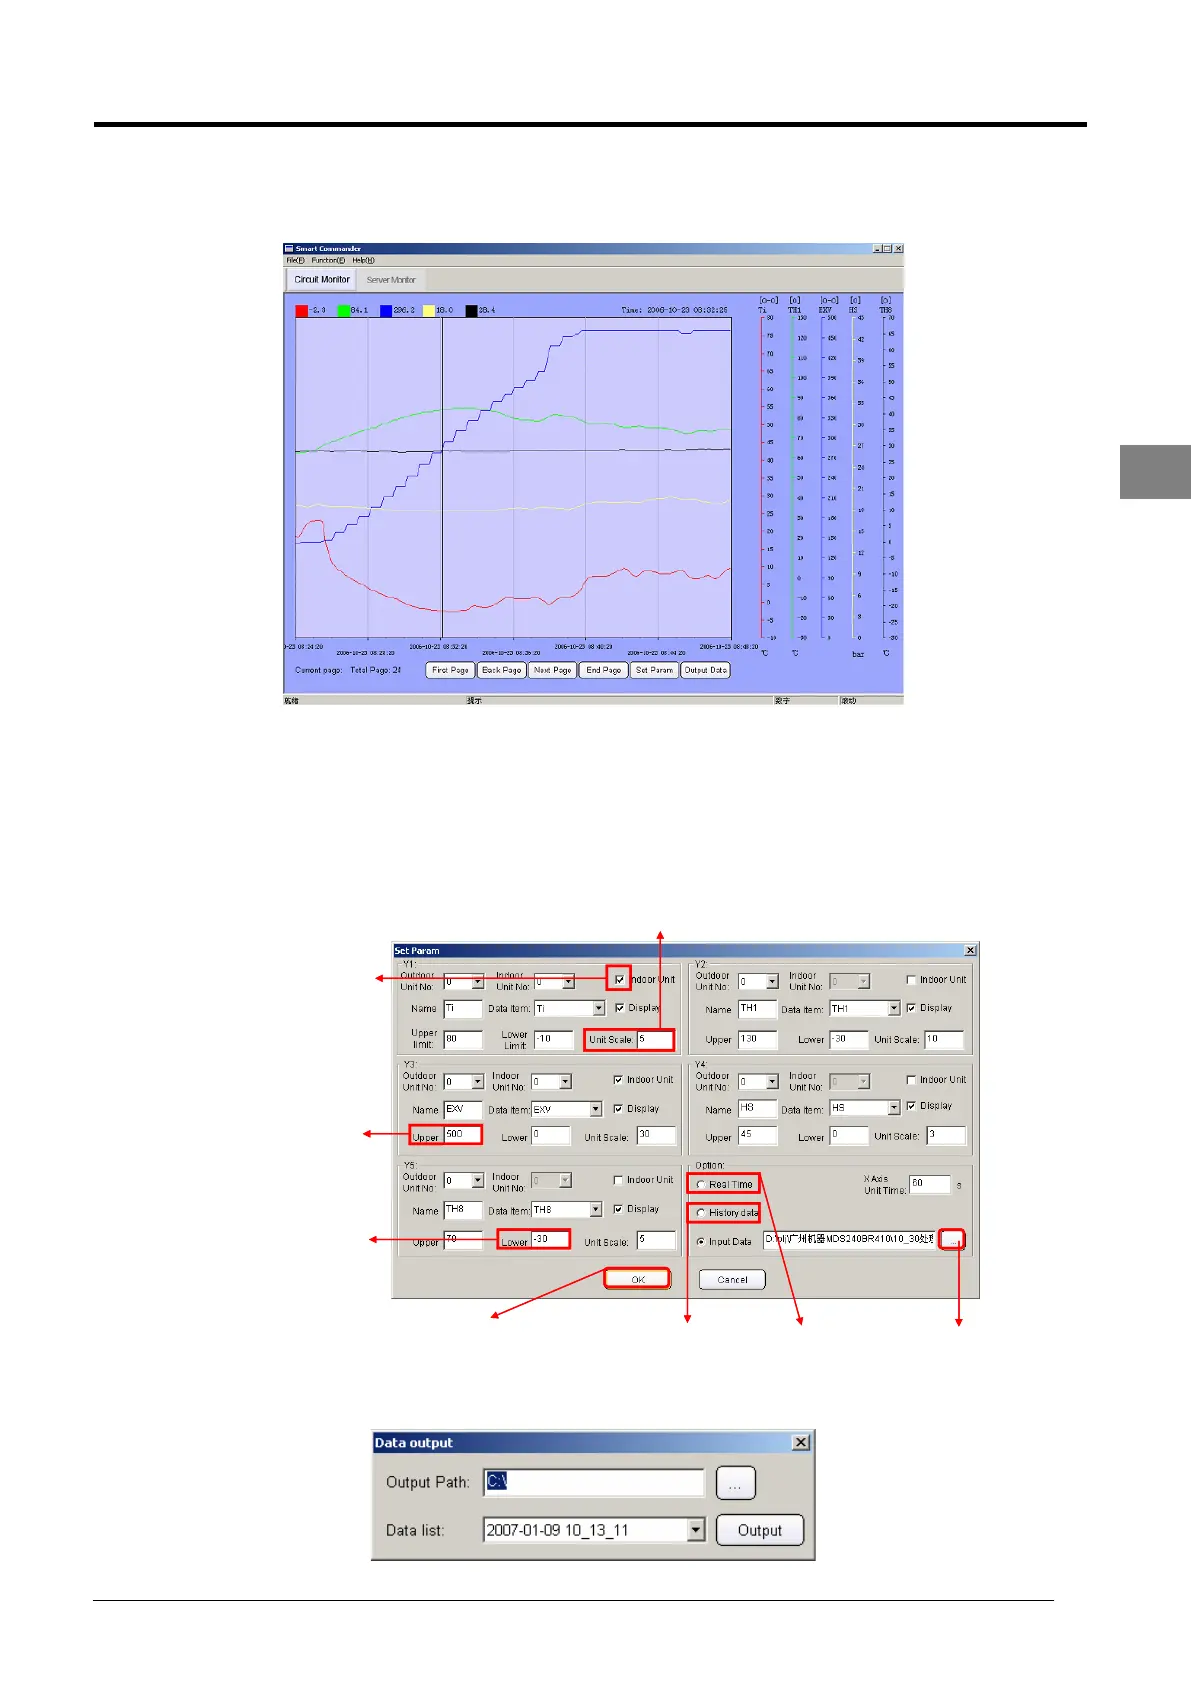
Service monitor interface is used to plot graph by using the MDS system parameter. By viewing the graph, it will
provide observation on the system operation condition. Total 5 parameters (outdoor or indoors) can be selected.
Service Monitor Window in Smart Commander
There are 6 function buttons at the bottom of Service Monitor screen. The function of the buttons is as follow:
First page : Proceed to the first page of the graph
Back page : Proceed to the previous page of the graph
Next page : Proceed to next page of the graph
End page : Proceed to the last page or the graph
Set Param : A new window will prompt out allowing user to determine which parameter to plot.
Tick to select ID
parameter to be
displayed
Tick to select ID
parameter to be
displayed
Max. value of Y-axisMax. value of Y-axis
Min. value of Y-axisMin. value of Y-axis
Major unitMajor unit
Display the data
of selected date
Display the data
of selected date
Display the data
of real time
Display the data
of real time
Click to display
the graph
Click to display
the graph
Input
file
Input
file
Output Data : A new window will prompt out allowing user to save the data (in excel sheet) to personal PC.
 Loading...