EN
Preparation for use / operating instructions | 29
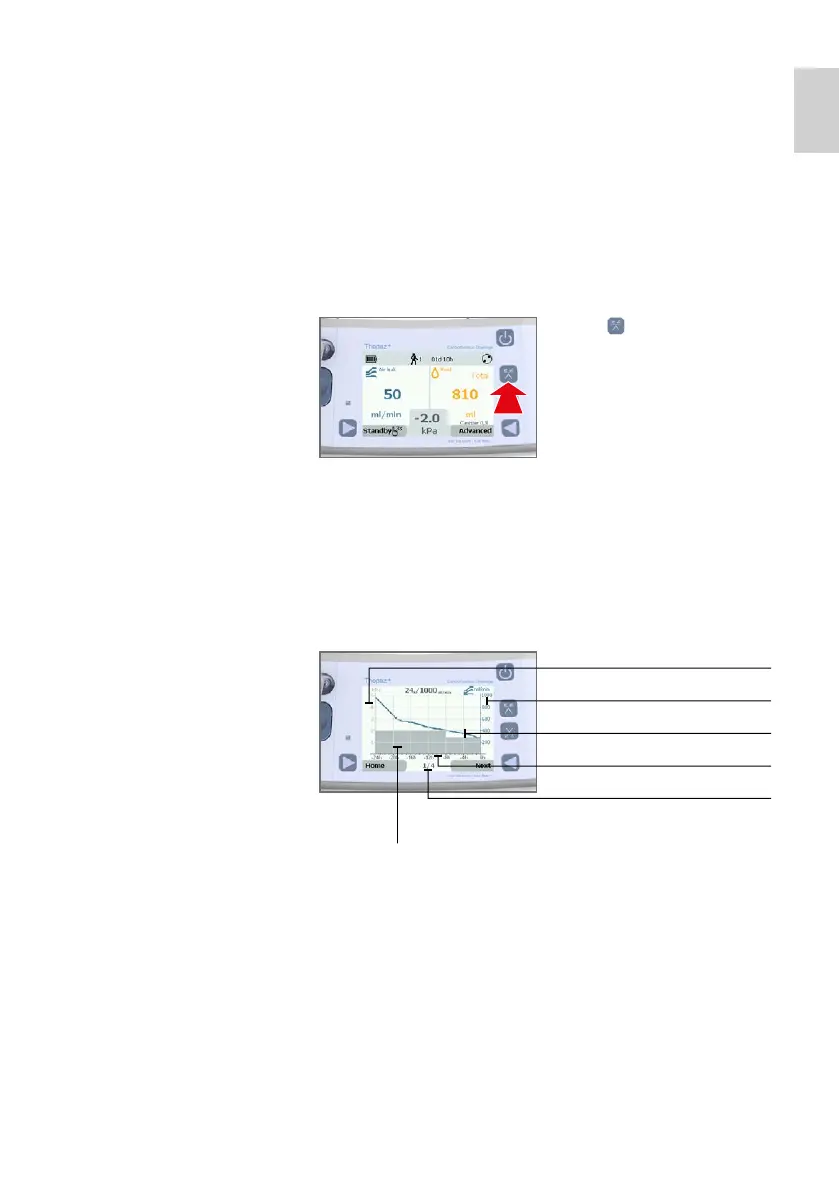
History – Thopaz
+
provides air leak history graphs and fluid history
graphs.
– For scrolling through the graphs press «Next».
– To get back to your main display press «Home».
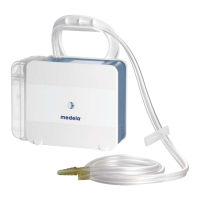
Air leak history
– Three different air leak history graphs (24 h/1000 ml/min,
24 h/100 ml/min, 72 h/Autoscale) plus the catheter check (see
chapter 7.7 – Catheter check) are available.
– The air leak autoscale history graph adjusts the air leak scale
to the largest measured air leak from the last 72 h to
1000/2000/3000/4000/5000 ml/min.
Press [ ] to get into the air
leak history.
Pressure scale
Air leak scale (in ml/min)
Air leak
Current time
Current page
Set and measured pressure
(depending on your settings)
7.6.2