CL-Profiler operating instructions page 10 of 15
www.cl-profiler.com
when it’s too high. If the speed is too high, it will be impossible to save
the data because it is not reliable.
During recording, the graph shows the real time sensor value, which also
includes the peaks between the bars.
Once recording is finished, the software will try to find the bars and show
one value for each bar. The curve is then converted from a flowing line to
a step-wise presentation, where each step represents a bar.
In the bar to bar measurement there are also 2 reports available, the Lin-
ear and Radial report. The bars can be represented in a circular plot (ra-
dial) or in linear fashion.
5) Open saved files
On the main screen, click on “Open measurement file’” (5) to open data
that was previously saved. When the data is shown, it is represented in
the graph exactly as it was when it was saved. The whole graph is in-
cluded in the data, also if one zoomed in, into a smaller part of the graph
when it was saved.
The tools and reports are the same as in previous paragraphs.
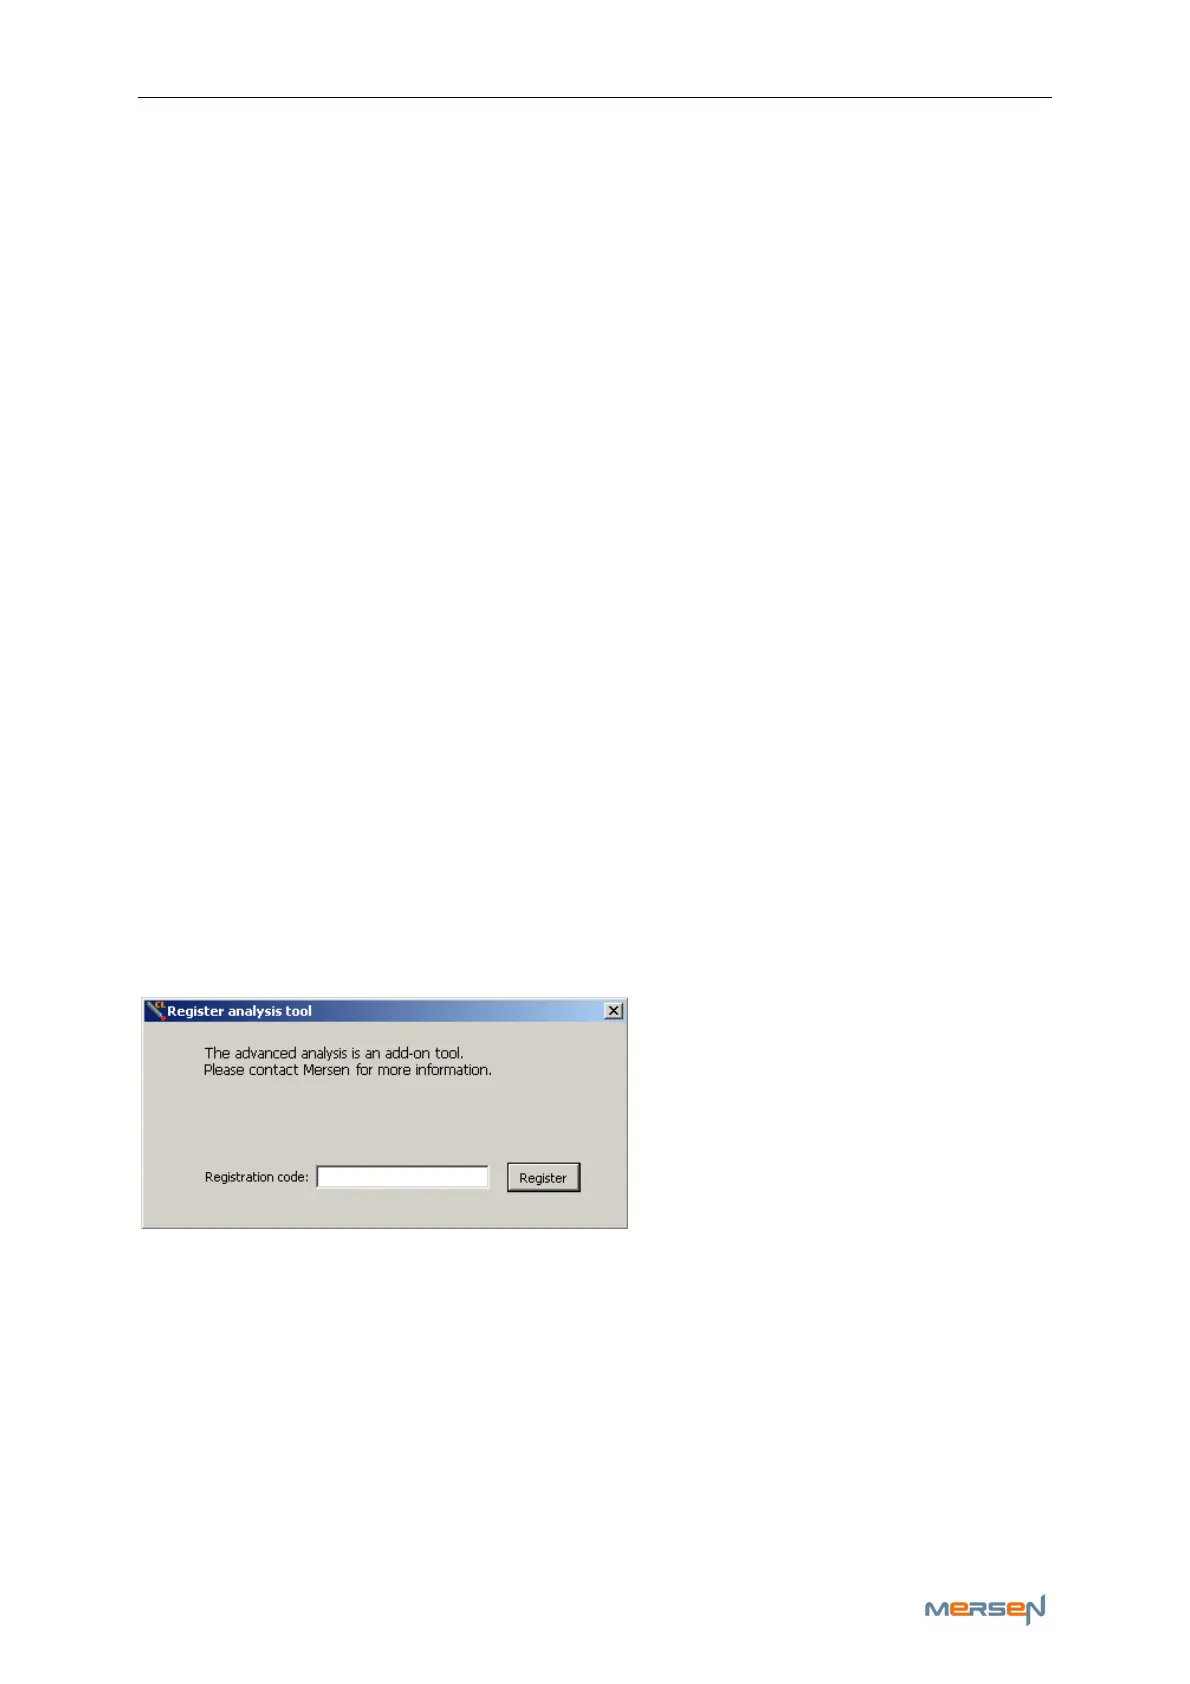
6) Measuring Analysing
Click on button (6) in the main screen to open the additional measuring
analysing screen, a new window pops up:
Fill in your ‘analysis registration
code’ and click “Register” to ac-
cess this additional tool.
This tool contains extra add-on functions for analysing and comparing re-
corded curves.