CL-Profiler operating instructions page 11 of 15
www.cl-profiler.com
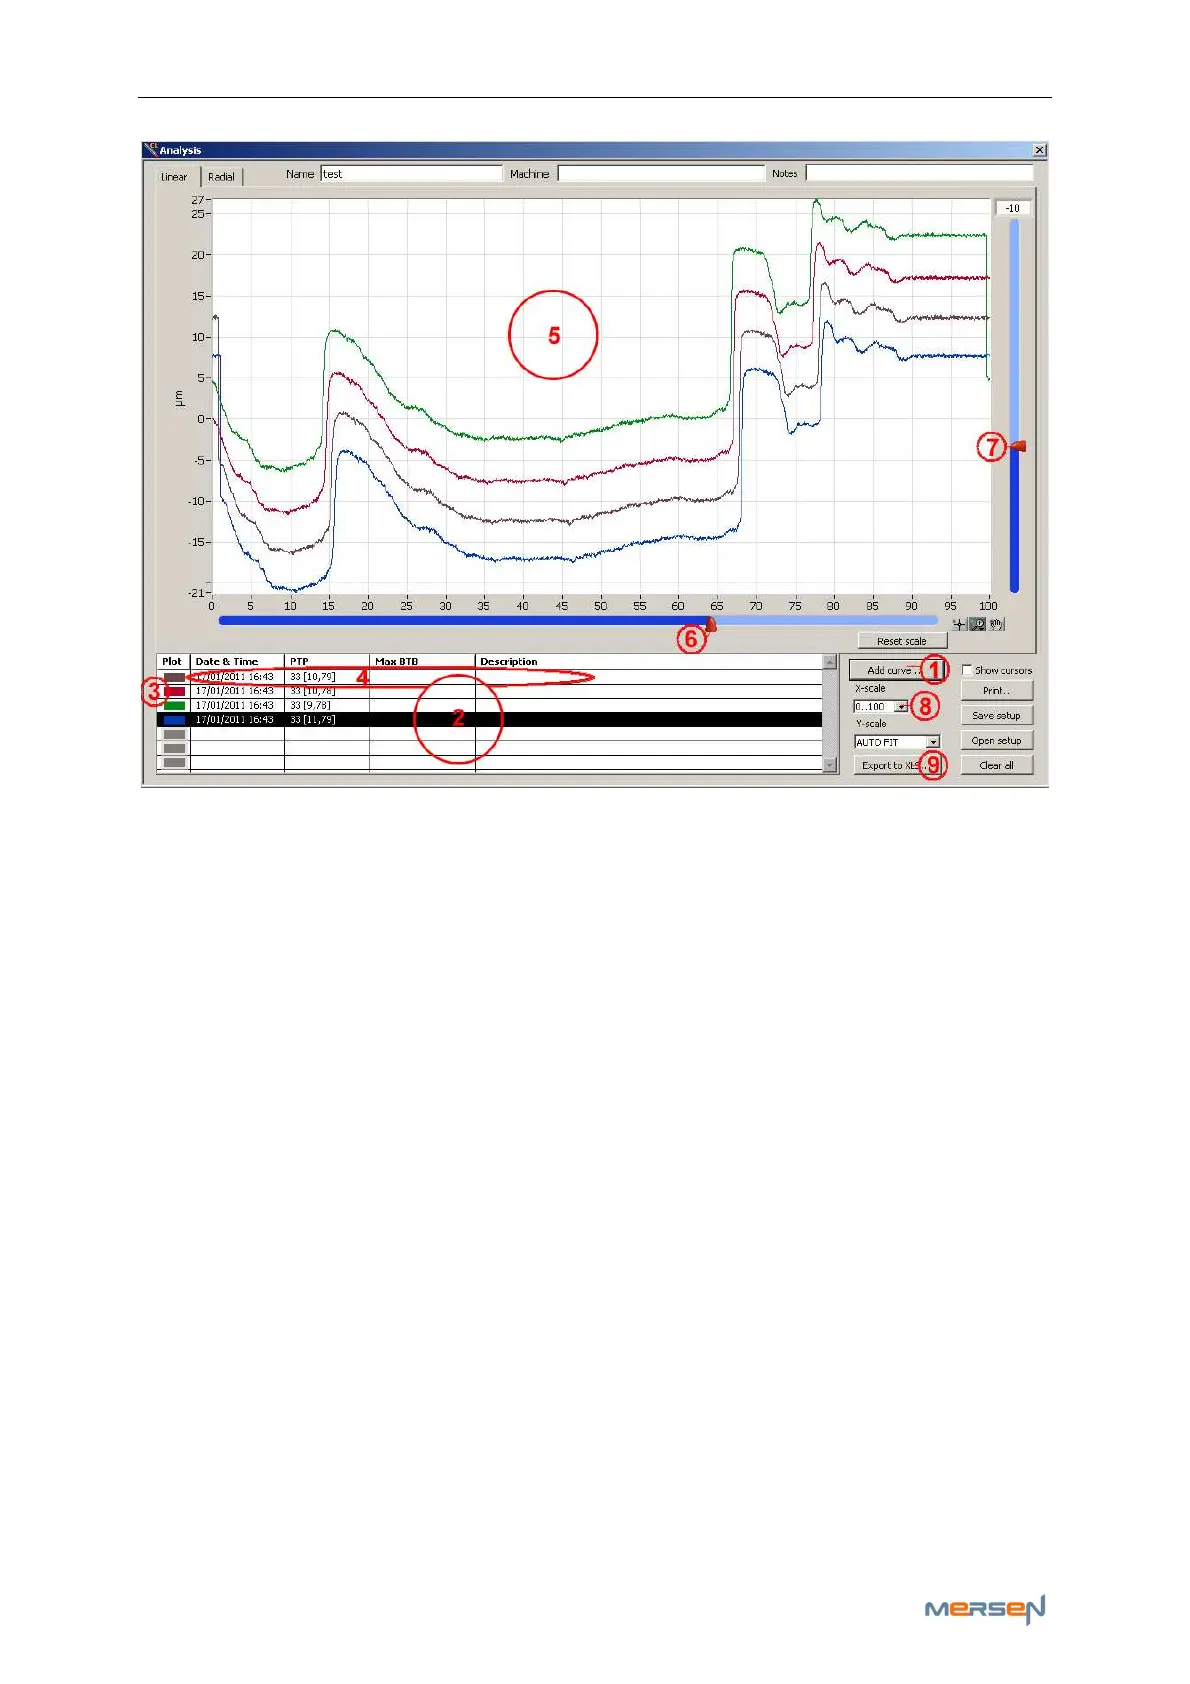
a - Add Curves
Press ‘Add curve’ (1) to add new curves. They will appear in the small
window on the left (2). You have the possibility to add up to a maximum
of 10 curves.
You can change the color of your curve [click (3)] and change the descrip-
tion or remove the curve by double clicking on the curve’s information
zone (4).
b - Curve’s position
You can change the curve’s position in window (5) by selecting the specific
curve in window (2) [click to select], and then adjust the sliders (6) and
(7). This way we can, for example, compare a previous measurement with
a more recent one at the same starting point.
d - X-Scale
The X-scale (8) can be adjusted to view in percent, bars, length and de-
grees
e - Export to Excel
Another additional feature in the ‘measuring analyzing’ function is export-
ing your measurements to an excel-file. This can be obtained by clicking
the ‘Export to XLS..’-button (9).