CL-Profiler operating instructions page 9 of 15
www.cl-profiler.com
Click on button (17) “Reset scale” to reset the scale like it was before
modification.
The peak to peak indicator (11) shows the difference between maximum
and minimum of the whole curve. The “peak to peak zoom” indicator (12)
shows the difference between maximum and minimum of the zoomed area
(in the example it’s the same).
g - Cursors
When activating the selection “Show cursors” (9), two cursor lines will ap-
pear on the screen: a blue (13) and a yellow (14) horizontal line. They are
useful for determining the difference between 2 points. The number (15)
at the yellow cursor shows the difference. For moving the cursor lines,
first select the cursor tool in the zoom palette, then move the mouse over
the blue or yellow cursor and click on to grab it.
Then you can drag it up or down.
The cursors will also be shown on the reports.
4) Bar to bar measurement
On the main screen click on button (4). A new window appears looking
very similar to the previous paragraph 3) Linear measurement. We will
only explain the difference.
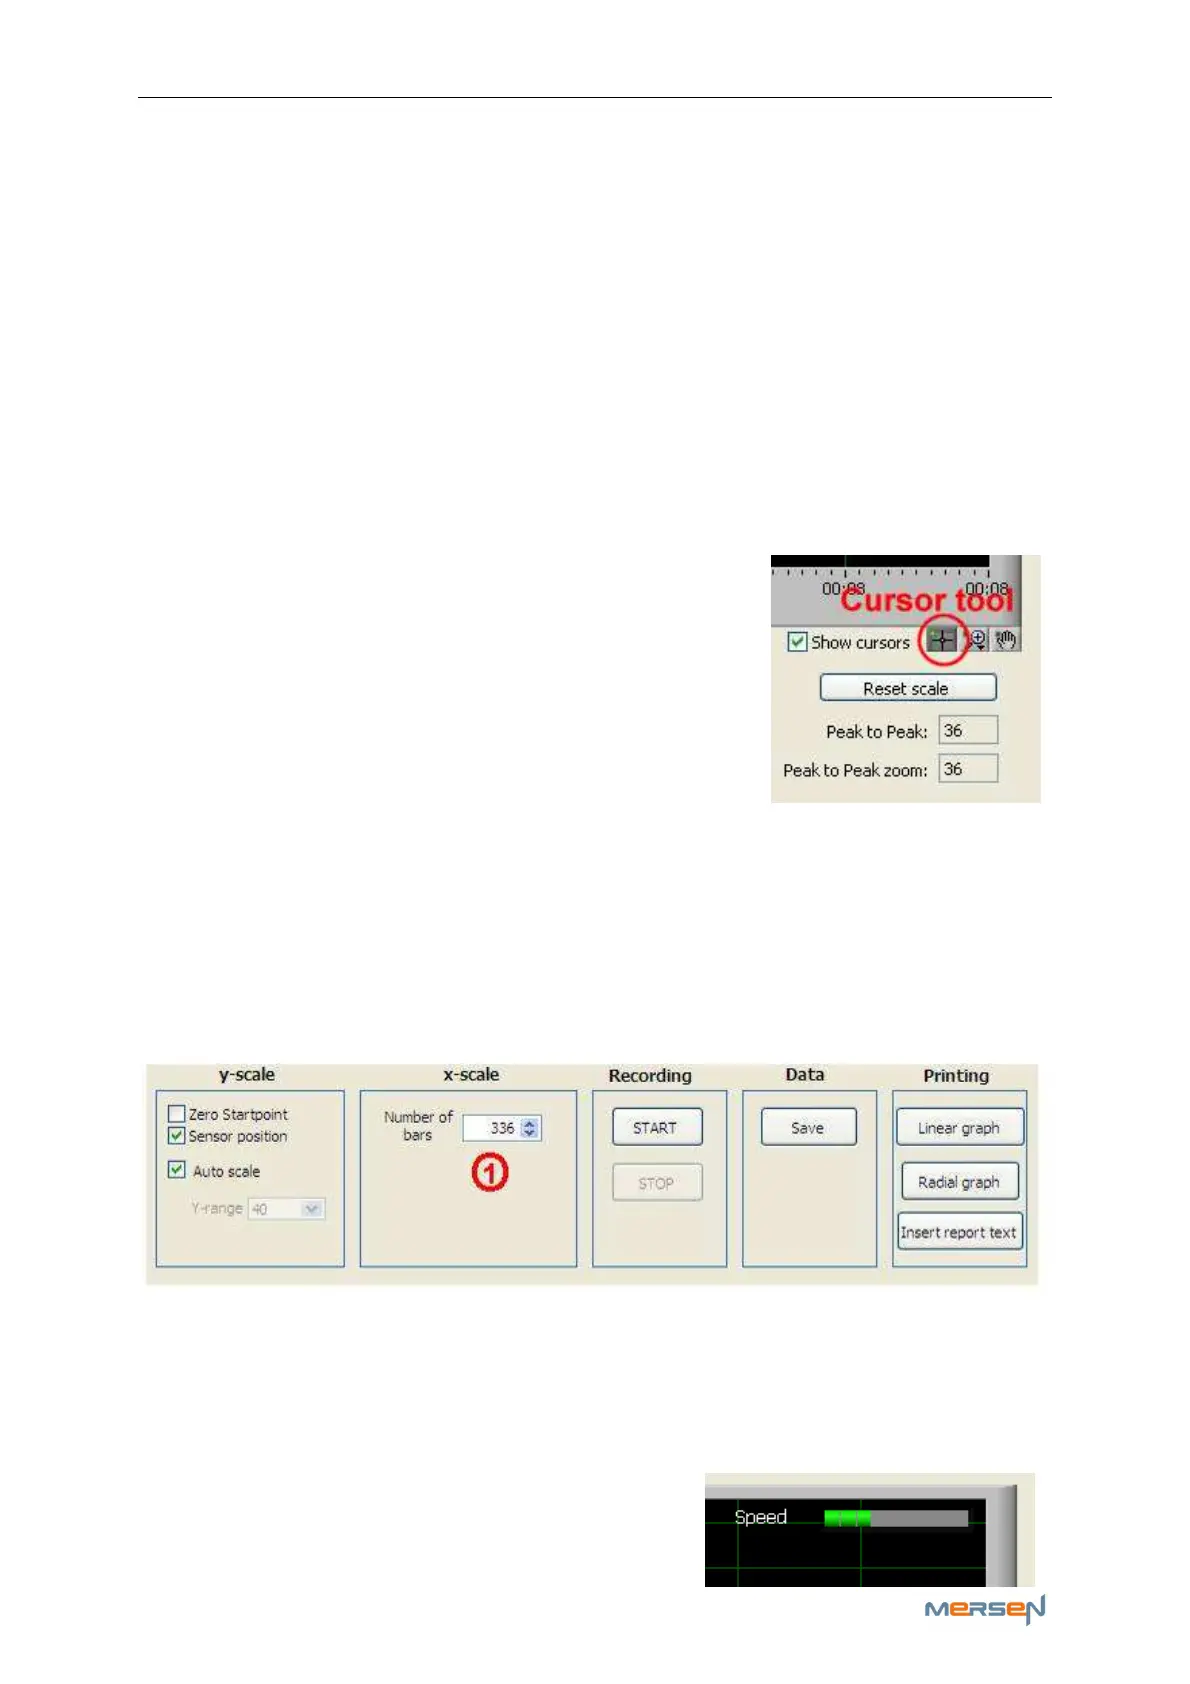
Instead of a recording time there is now a setting “number of bars” (1).
While recording, the software tries to detect the bars by the peaks that
appear when the sensor jumps down between two successive bars. It is
important that the speed of the rotor is not too high, to be able to meas-
ure these peaks and bar values correctly. Limit the rotating speed to a
maximum of 30 bars per second. An indicator on the top of the graph will
show the speed. It is green when the speed
is OK, orange when it gets high, and red