20
THEORY
as kinetics of sorption. Therefore, to provide the most information about the moisture
characteristics of a material, both types of isotherms are needed. The VSA can provide both
DVS and DDI isotherms and even run them both on one sample.
3.2 HYSTERESIS
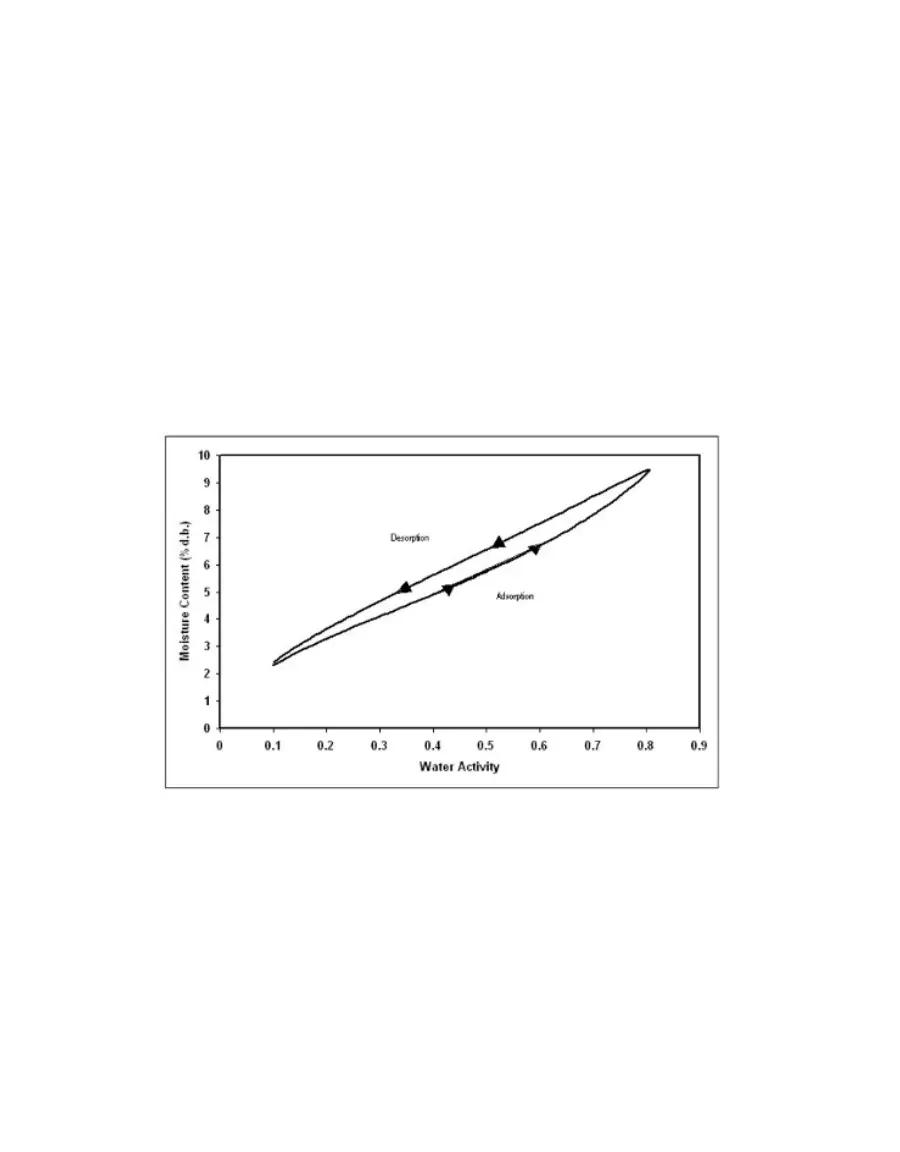
Figure 20 shows two isotherms, one obtained by wetting a sample from complete dryness
and the other obtained by drying a sample from saturation. The arrows show the direction of
the process. The water content at each water activity is higher during desorption (drying from
high water content) than adsorption (wetting from low water content). This phenomenon is
called hysteresis. The curves in Figure 20 represent limits or boundary isotherms since they
begin at water activities near zero and one. If a drying process reduces the water activity of a
sample only part way to dryness, and the sample is then wet again, it follows a path between
the wetting and drying boundary curves, as shown in Figure 21. These curves are called
scanning curves, and there can be an infinite number of them depending on where drying
stops and starts.
Figure 20 Full isotherm showing hysteresis