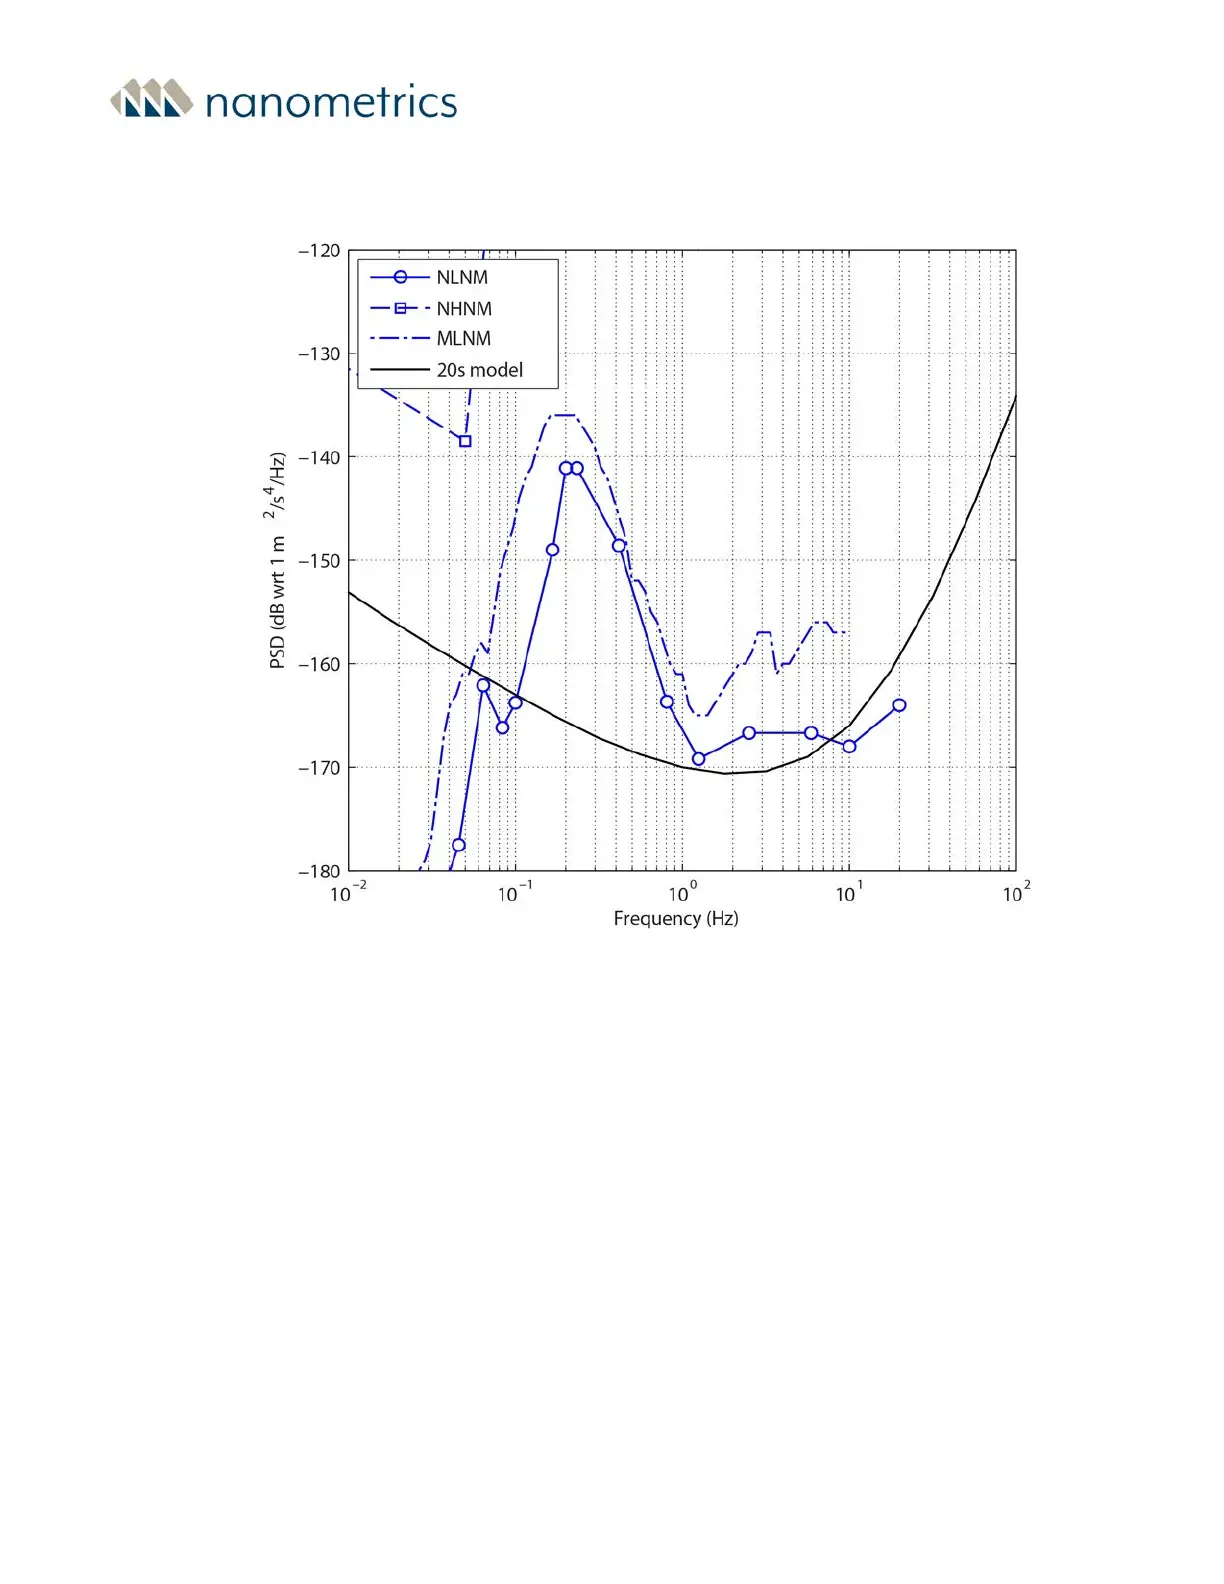
Figure 10-3 - Noise floor figure for 20 s models
To determine the dynamic range at frequencies of interest for your application, compare the
noise floor to the Trillium Compact seismometer clip level using Figure 10-4. For the purpose
of comparing noise floors to clip levels, Figure 10-4 converts power spectral densities using
octave bandwidths and an RMS-to-peak conversion factor of 1.253.
Chapter 10 - Performance
16889R10 • 2020-11-12 Page 77