4-26 Description
The minimum hold time is of 500 milliseconds.
The maximum is 10 minutes.
The time span of the graph is 200 times the hold time. The rolling
measurement memory deletes all values that date back longer than
the set time period.
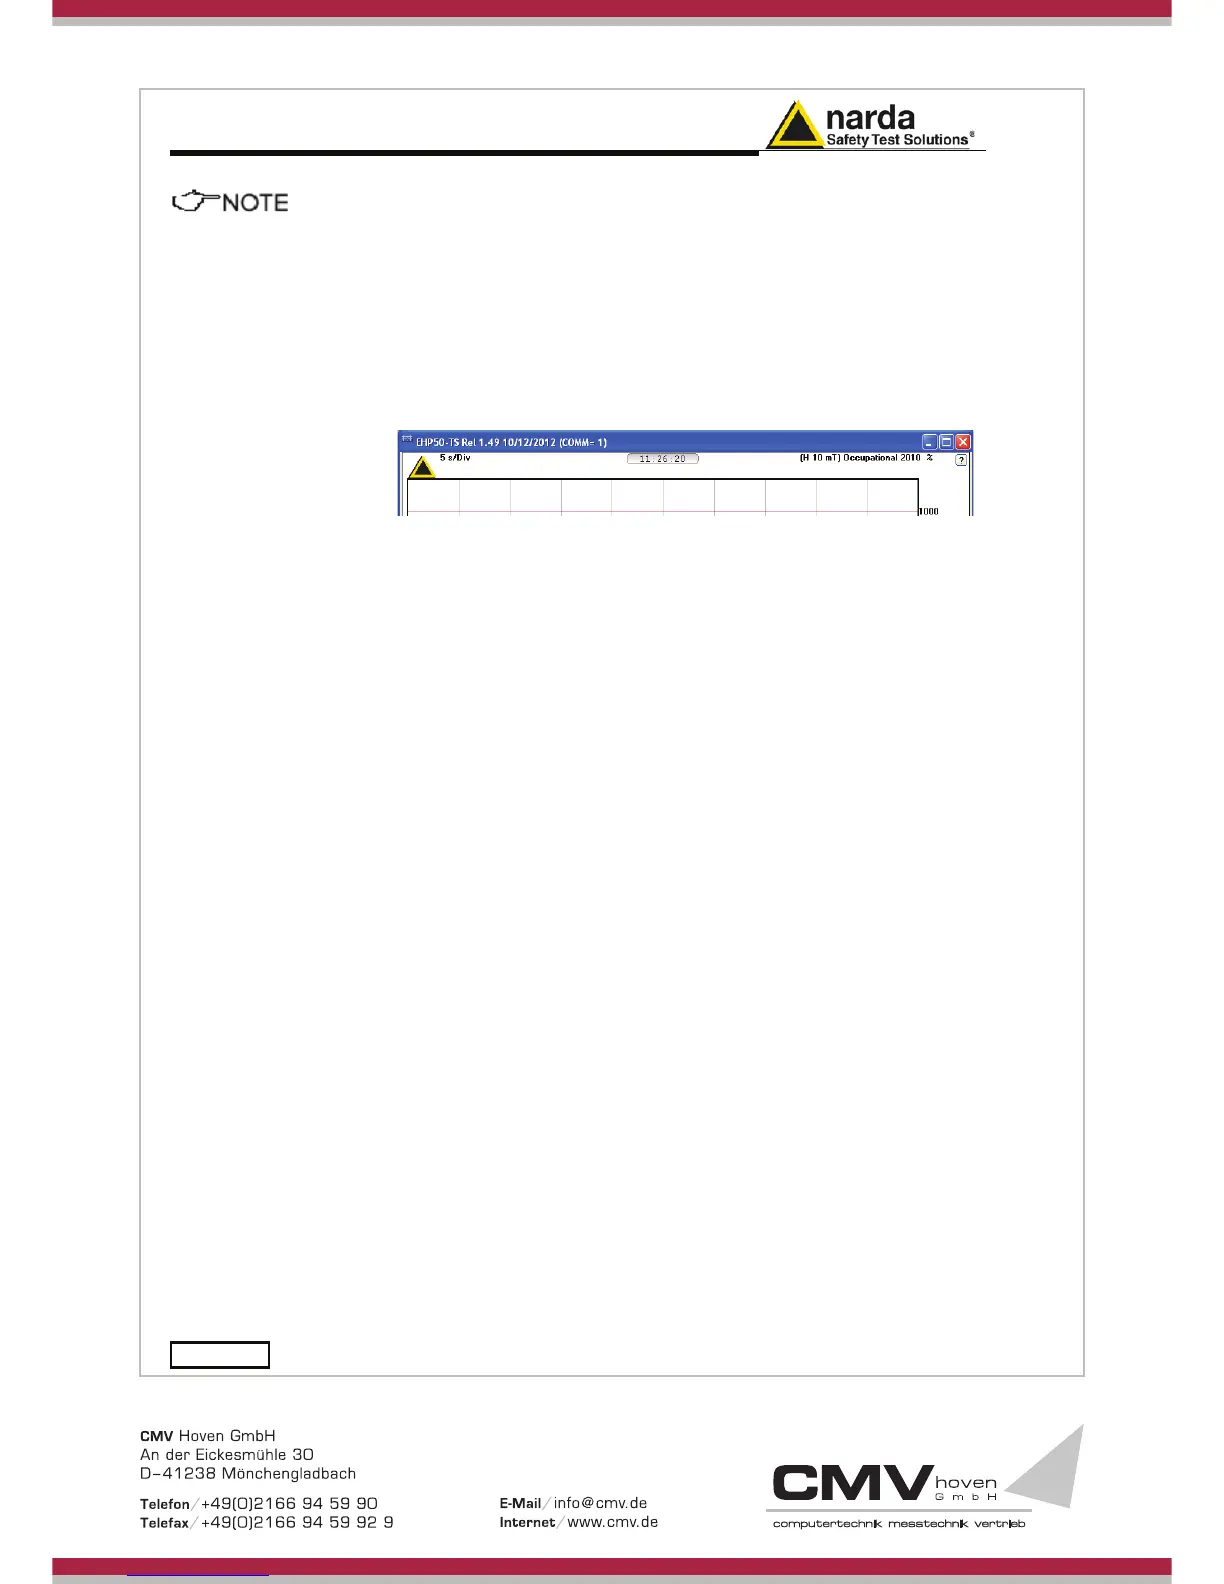
The limit selected is shown in the higher right corner of the graph.
The full scale is automatically adapted to the field and the limit selected.
In the centre, above the grid of the graph, the time indication is the actual
time, the instant in which the measurement is made, at the end of the hold
time step.