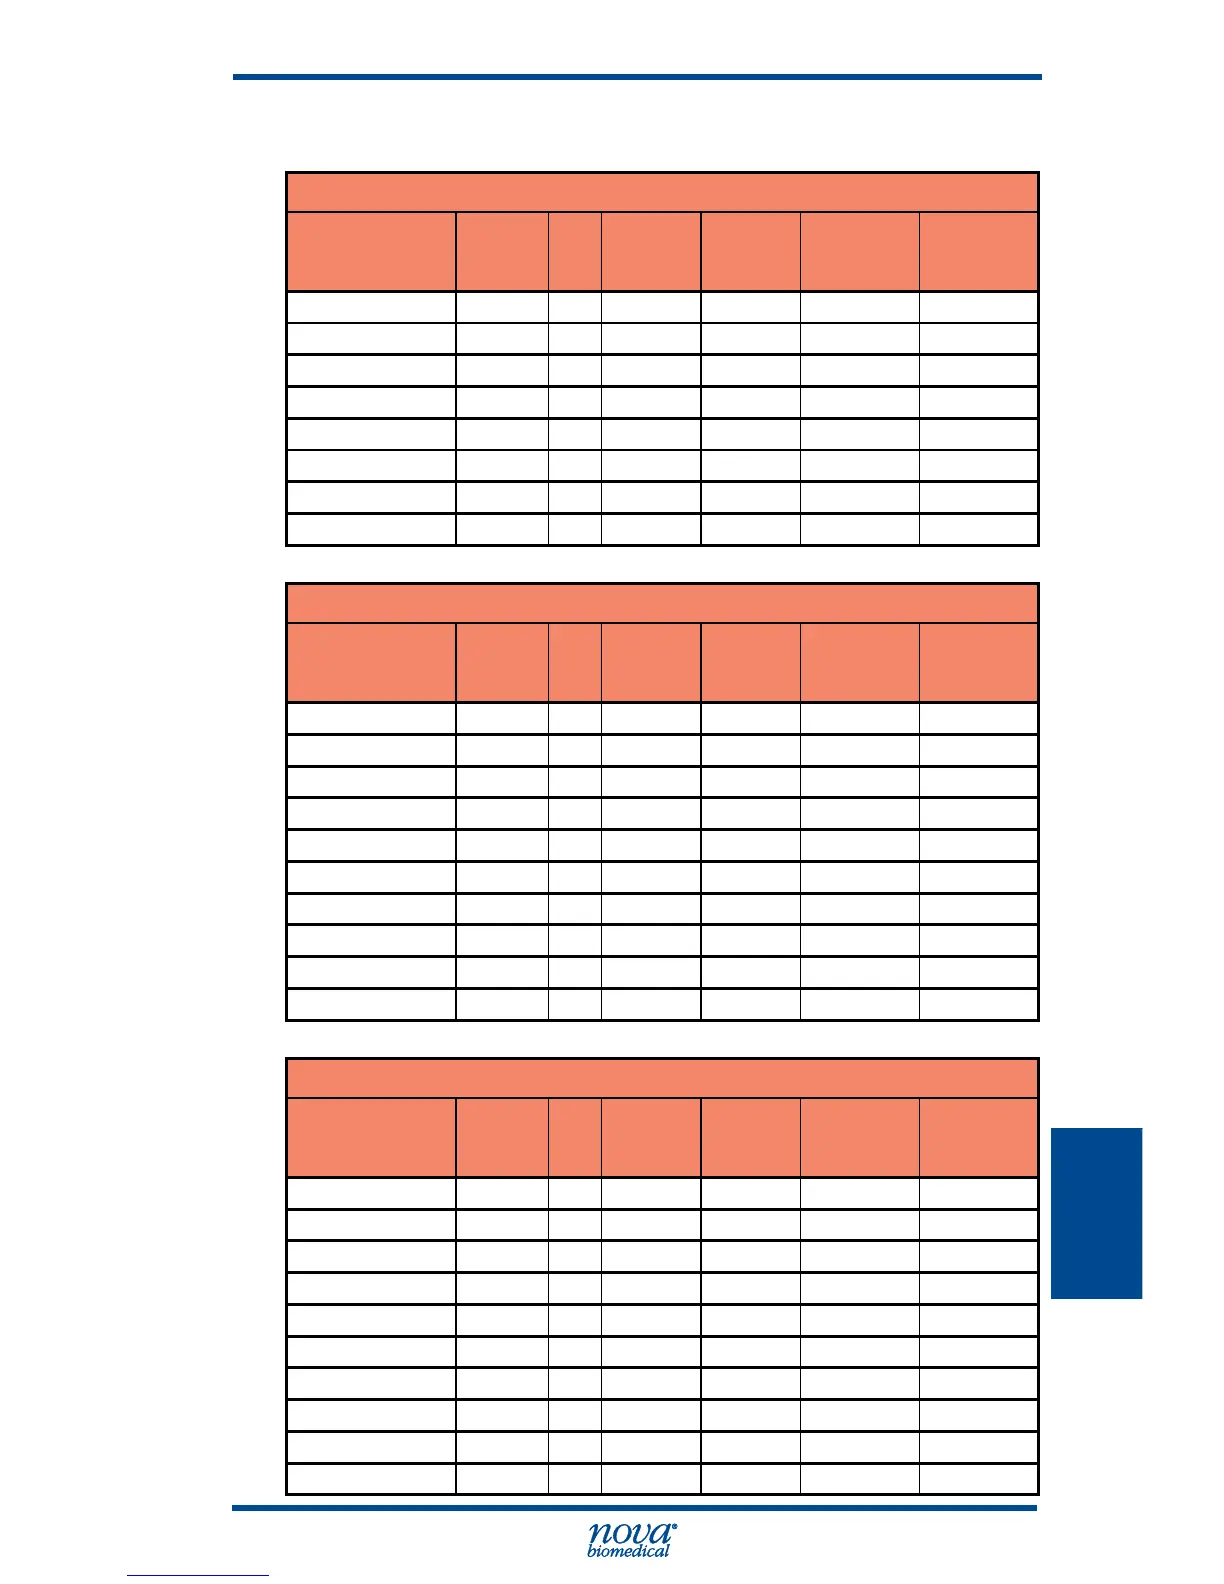
Run-to-Run Precision Results
pH Precision Data
Sample
Pooled
Mean
N
Within run
SD (Sr)
Within
run % CV
Total
imprecision
SD (St)
Total
Imprecision
%CV
QC Level 1 7.164 240 0.002 --- 0.002 ---
QC Level 2 7.362 240 0.000 --- 0.001 ---
QC Level 3 7.596 240 0.000 --- 0.002 ---
Linearity Std 1 6.899 240 0.003 --- 0.005 ---
Linearity Std 2 7.186 240 0.001 --- 0.003 ---
Linearity Std 3 7.444 240 0.001 --- 0.002 ---
Linearity Std 4 7.615 240 0.001 --- 0.002 ---
Linearity Std 5 7.817 240 0.002 --- 0.004 ---
PCO
2
Precision Data
Sample
Pooled
Mean
(mmHg)
N
Within run
SD (Sr)
Within
run % CV
Total
imprecision
SD (St)
Total
Imprecision
%CV
QC Level 1 58.4 240 0.58 1.00 1.33 2.28
QC Level 2 41.9 240 0.06 0.13 0.53 1.26
QC Level 3 23.0 240 0.07 0.29 0.42 1.83
Linearity Std 1 76.6 240 0.46 0.60 2.22 2.90
Linearity Std 2 61.4 240 0.19 0.31 1.32 2.16
Linearity Std 3 41.0 240 0.36 0.88 0.59 1.44
Linearity Std 4 25.3 240 0.06 0.23 0.51 2.02
Linearity Std 5 17.3 240 0.10 0.56 0.83 4.82
Blood Gas ( A ) 26.5 240 0.34 1.29 0.93 3.52
Blood Gas ( B ) 53.4 240 0.44 0.82 2.03 3.80
PO
2
Precision Data
Sample
Pooled
Mean
(mmHg)
N
Within run
SD (Sr)
Within
run % CV
Total
imprecision
SD (St)
Total
Imprecision
%CV
QC Level 1 70.2 240 0.84 1.19 2.02 2.88
QC Level 2 110.1 240 0.55 0.50 1.16 1.05
QC Level 3 143.8 240 0.39 0.27 1.21 0.84
Linearity Std 1 21.6 240 1.45 6.73 2.68 12.43
Linearity Std 2 60.6 240 1.07 1.77 2.96 4.88
Linearity Std 3 107.2 240 0.98 0.91 2.23 2.08
Linearity Std 4 158.9 240 0.69 0.44 2.41 1.52
Linearity Std 5 453.9 240 3.92 0.86 14.33 3.16
Blood Gas ( A ) 111.5 240 1.29 1.16 3.05 2.74
Blood Gas ( B ) 61.4 240 0.50 0.81 2.09 3.40