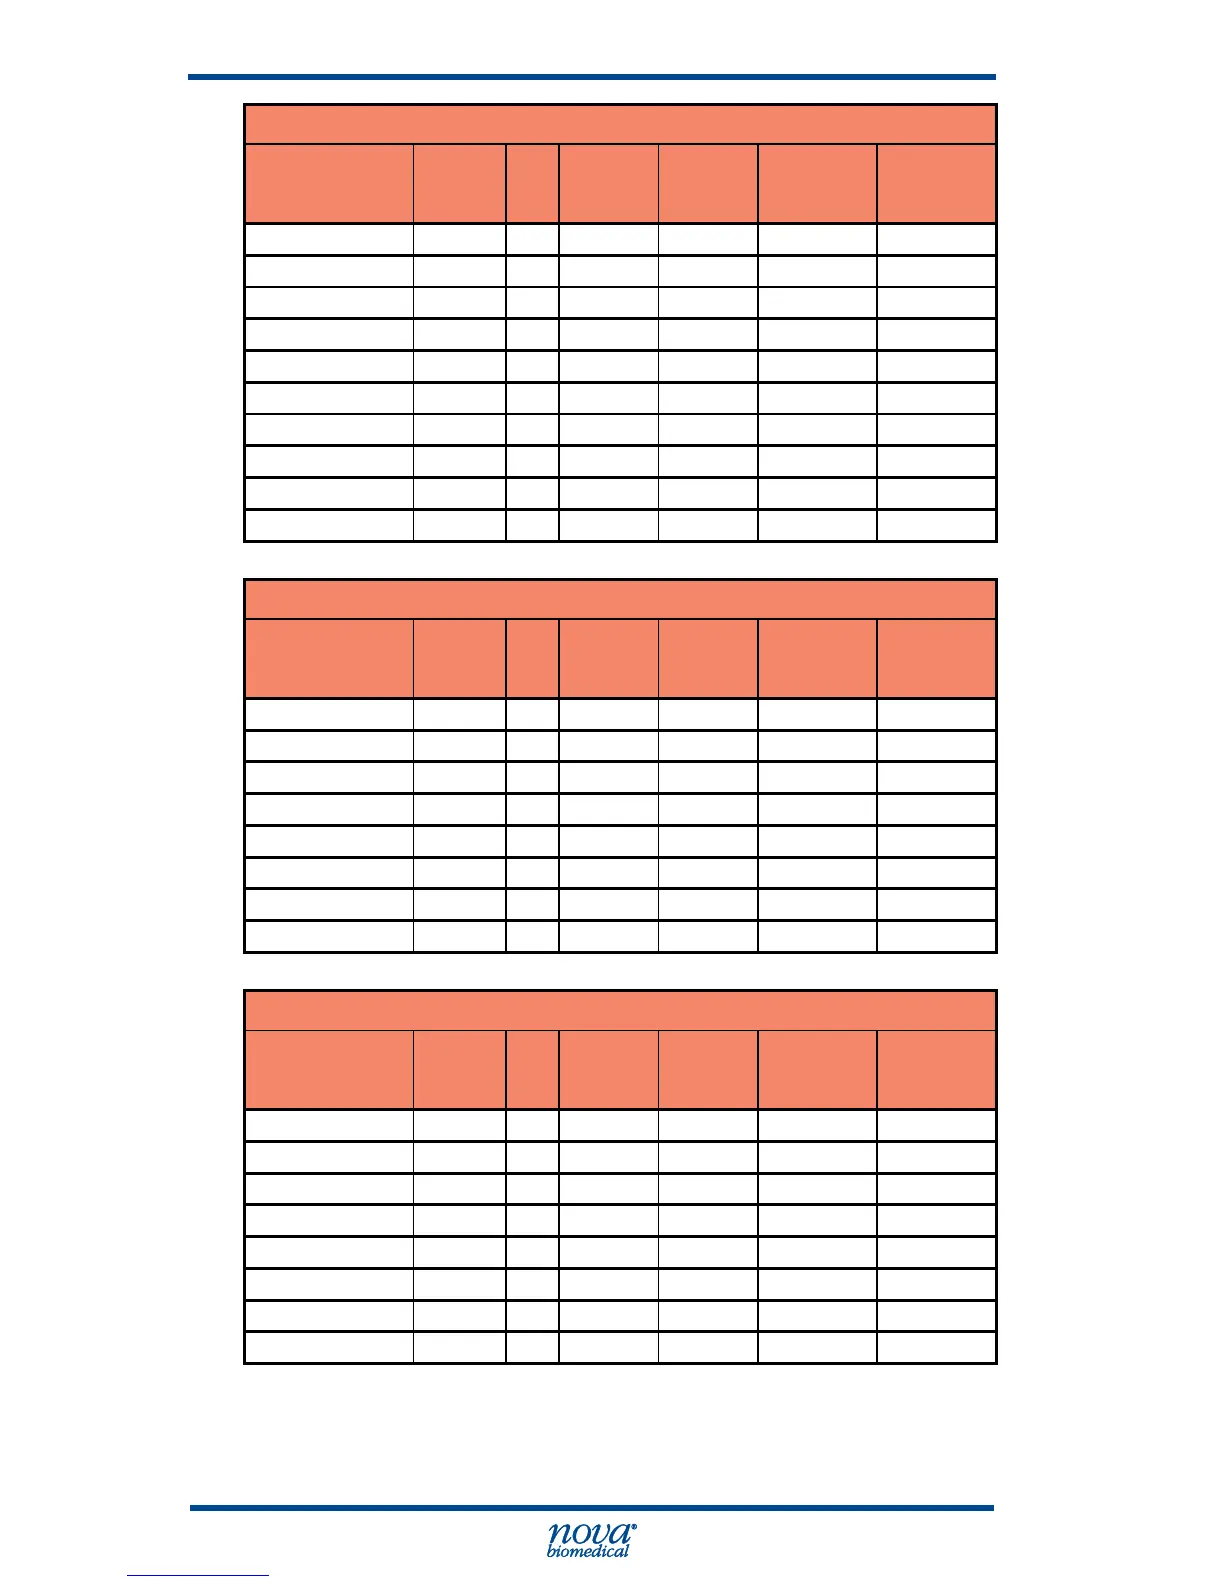
Hct Precision Data
Sample
Pooled
Mean (%)
N
Within run
SD (Sr)
Within
run % CV
Total
imprecision
SD (St)
Total
Imprecision
%CV
QC Level 1 37.9 240 0.44 1.15 0.81 2.15
QC Level 2 55.0 240 0.20 0.37 0.32 0.58
QC Level 3 68.6 240 0.18 0.26 0.43 0.63
Linearity Std 1 73.4 240 0.30 0.41 0.43 0.59
Linearity Std 2 58.5 240 0.38 0.65 0.44 0.74
Linearity Std 3 55.3 240 0.29 0.52 0.41 0.73
Linearity Std 4 36.4 240 0.34 0.93 0.45 1.24
Linearity Std 5 27.7 240 0.38 1.37 0.48 1.73
Hct ( A ) 43.4 240 0.20 0.46 1.12 2.57
Hcy ( B ) 60.7 240 0.28 0.47 1.22 2.01
Na Precision Data
Sample
Pooled
Mean
(mmol/L)
N
Within run
SD (Sr)
Within
run % CV
Total
imprecision
SD (St)
Total
Imprecision
%CV
QC Level 1 158.3 240 0.56 0.35 0.68 0.43
QC Level 2 140.1 240 0.12 0.09 0.25 0.18
QC Level 3 120.2 240 0.08 0.07 0.18 0.15
Linearity Std 1 89.7 240 0.45 0.50 0.56 0.62
Linearity Std 2 116.1 240 0.25 0.21 0.52 0.45
Linearity Std 3 132.0 240 0.53 0.40 0.71 0.54
Linearity Std 4 154.5 240 0.40 0.26 0.63 0.41
Linearity Std 5 163.7 240 0.43 0.26 0.80 0.49
K Precision Data
Sample
Pooled
Mean
(mmol/L)
N
Within run
SD (Sr)
Within
run % CV
Total
imprecision
SD (St)
Total
Imprecision
%CV
QC Level 1 5.81 240 0.020 0.34 0.03 0.48
QC Level 2 3.81 240 0.005 0.14 0.01 0.36
QC Level 3 1.87 240 0.002 0.13 0.02 0.97
Linearity Std 1 11.70 240 0.041 0.35 0.07 0.59
Linearity Std 2 1.91 240 0.006 0.32 0.02 0.92
Linearity Std 3 4.36 240 0.014 0.32 0.02 0.55
Linearity Std 4 6.38 240 0.024 0.38 0.04 0.63
Linearity Std 5 1.60 240 0.006 0.40 0.02 1.23