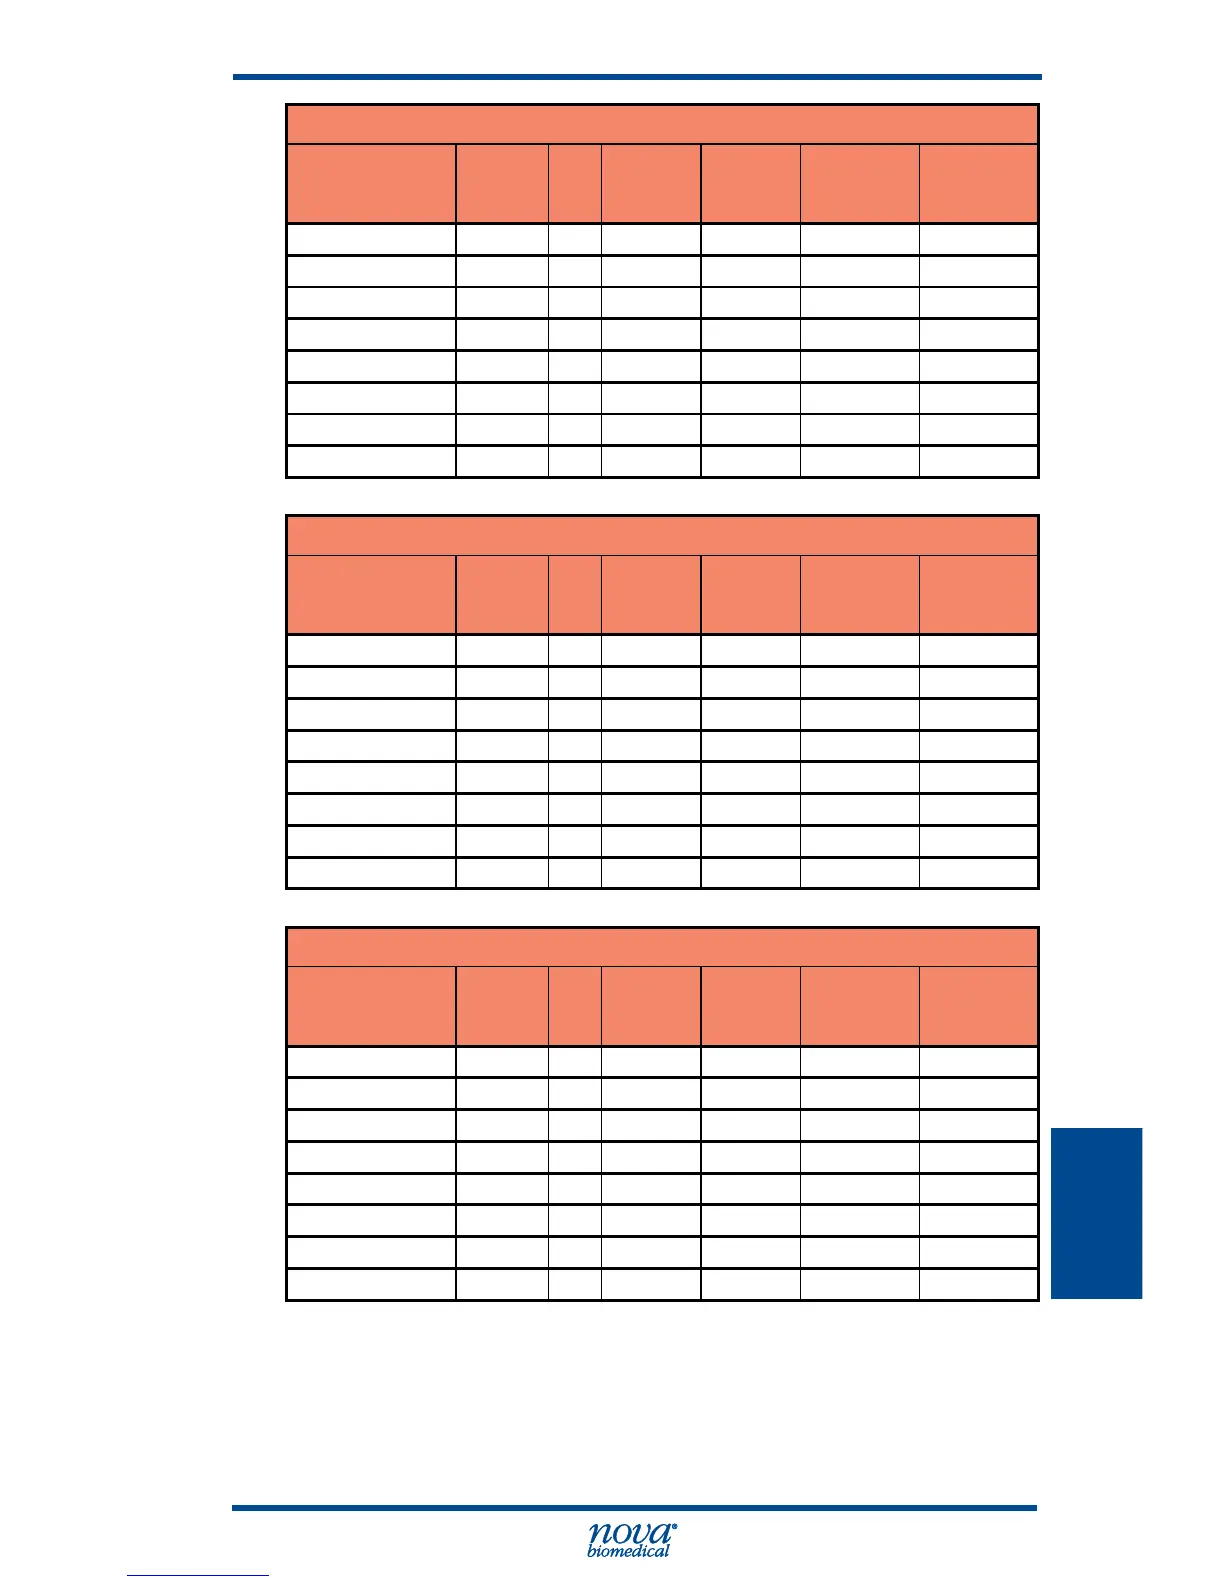
iCa Precision Data
Sample
Pooled
Mean
(mmol/L)
N
Within run
SD (Sr)
Within
run % CV
Total
imprecision
SD (St)
Total
Imprecision
%CV
QC Level 1 1.51 240 0.007 0.45 0.02 1.13
QC Level 2 0.97 240 0.002 0.22 0.00 0.43
QC Level 3 0.53 240 0.001 0.23 0.01 1.85
Linearity Std 1 2.81 240 0.031 1.09 0.05 1.78
Linearity Std 2 1.44 240 0.004 0.26 0.01 0.53
Linearity Std 3 1.06 240 0.002 0.21 0.01 0.63
Linearity Std 4 0.51 240 0.001 0.14 0.01 1.31
Linearity Std 5 0.17 240 0.001 0.58 0.01 6.38
Cl Precision Data
Sample
Pooled
Mean
(mmol/L)
N
Within run
SD (Sr)
Within
run % CV
Total
imprecision
SD (St)
Total
Imprecision
%CV
QC Level 1 131.5 240 0.57 0.43 2.30 1.75
QC Level 2 103.0 240 0.72 0.70 1.52 1.48
QC Level 3 86.1 240 0.27 0.32 1.38 1.60
Linearity Std 1 73.5 240 0.15 0.21 1.26 1.71
Linearity Std 2 82.6 240 0.10 0.12 0.67 0.82
Linearity Std 3 100.5 240 0.11 0.11 0.67 0.66
Linearity Std 4 124.5 240 0.11 0.09 1.45 1.17
Linearity Std 5 133.5 240 0.13 0.10 2.04 1.53
Glucose Precision Data
Sample
Pooled
Mean
(mg/dL)
N
Within run
SD (Sr)
Within
run % CV
Total
imprecision
SD (St)
Total
Imprecision
%CV
QC Level 1 71.3 240 1.28 1.79 1.69 2.37
QC Level 2 196.9 240 0.81 0.41 1.33 0.67
QC Level 3 318.6 240 2.32 0.73 3.31 1.04
Linearity Std 1 378.0 240 5.31 1.41 14.89 3.94
Linearity Std 2 67.4 240 0.60 0.88 2.46 3.64
Linearity Std 3 179.7 240 1.64 0.91 3.79 2.11
Linearity Std 4 260.0 240 1.92 0.74 5.50 2.11
Linearity Std 5 n/a