Analyzing a Measurement 63
• Resistivity: The ground resistivity is measured in Ohm-Meter (Ωm) and indicates the resistance
of the underground at the current scan point and depth. It is mainly calculated by the power,
voltage and distance of the electrodes. This value is only available in active scan modes.
The resistivity value is the basis of further calculations concerning underground water deposits and
cavities.
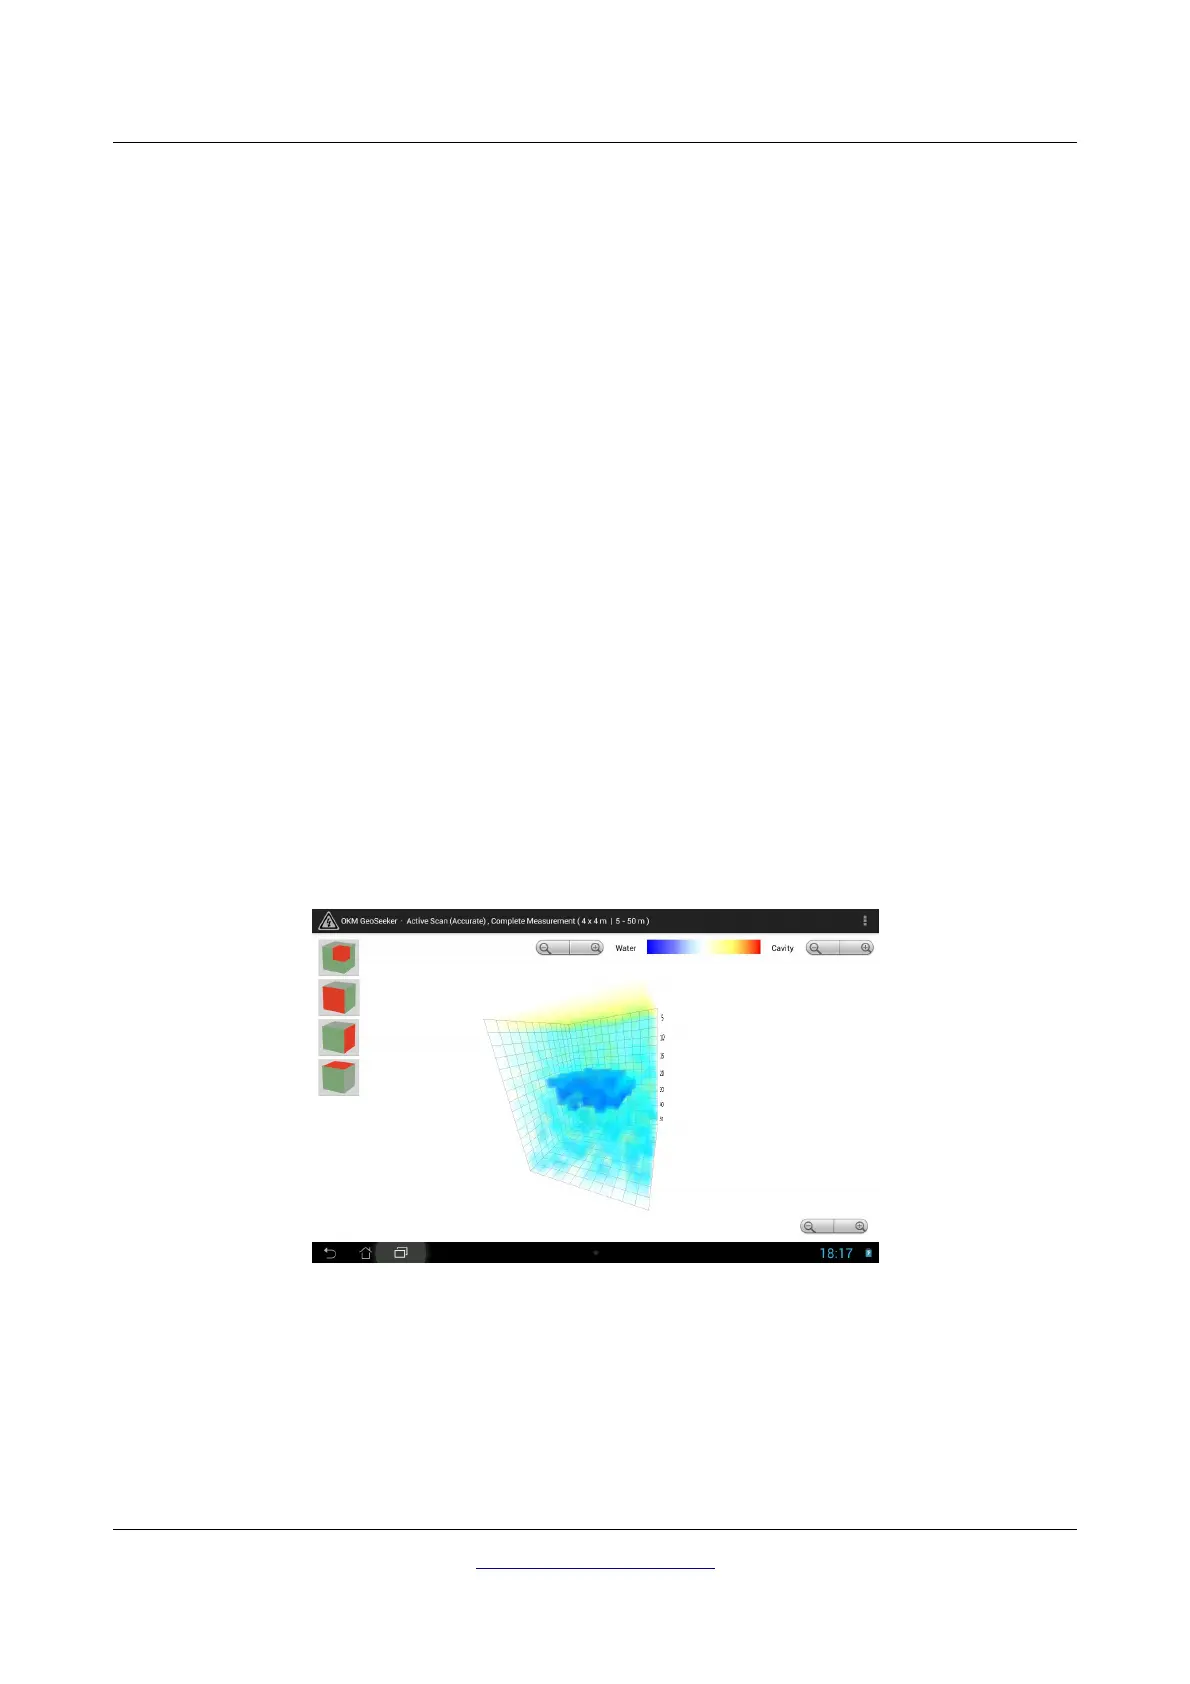
8.2 Interpretation of graphical representations
After completing a measurement you can also generate a 3d graphic of the measured values. The values
on which the 3d representation is based on depends on the scan mode of the measurement.
8.2.1 Active Scan
After completing an active scan the 3d graphic is representing the ground resistivity values in different
colors, as shown in figure 8.2, to highlight potential places of very high and low conductivity. The color's
meanings are:
• Blue: This color indicates a high conductivity and a low resistivity as typical for underground
water deposits.
• Yellow / White: This color indicates a medium conductivity and resistivity as typical for normal
underground soil.
• Red: This color indicates a low conductivity and a high resistivity as typical for underground
cavities or impervious layers.
After conducting an active scan you will also get some kind of depth estimation. Please keep in mind that
the indicated depths are maximum depths only. In most cases the indicated depth is often higher than
the real depth might be but it will give you a rough estimation where the objects of your desire may be.
Each cube in the 3d graphic is representing a measure value of your scan field.
OKM GmbH
www.okmmetaldetectors.com
 Loading...