25
Information on body composition
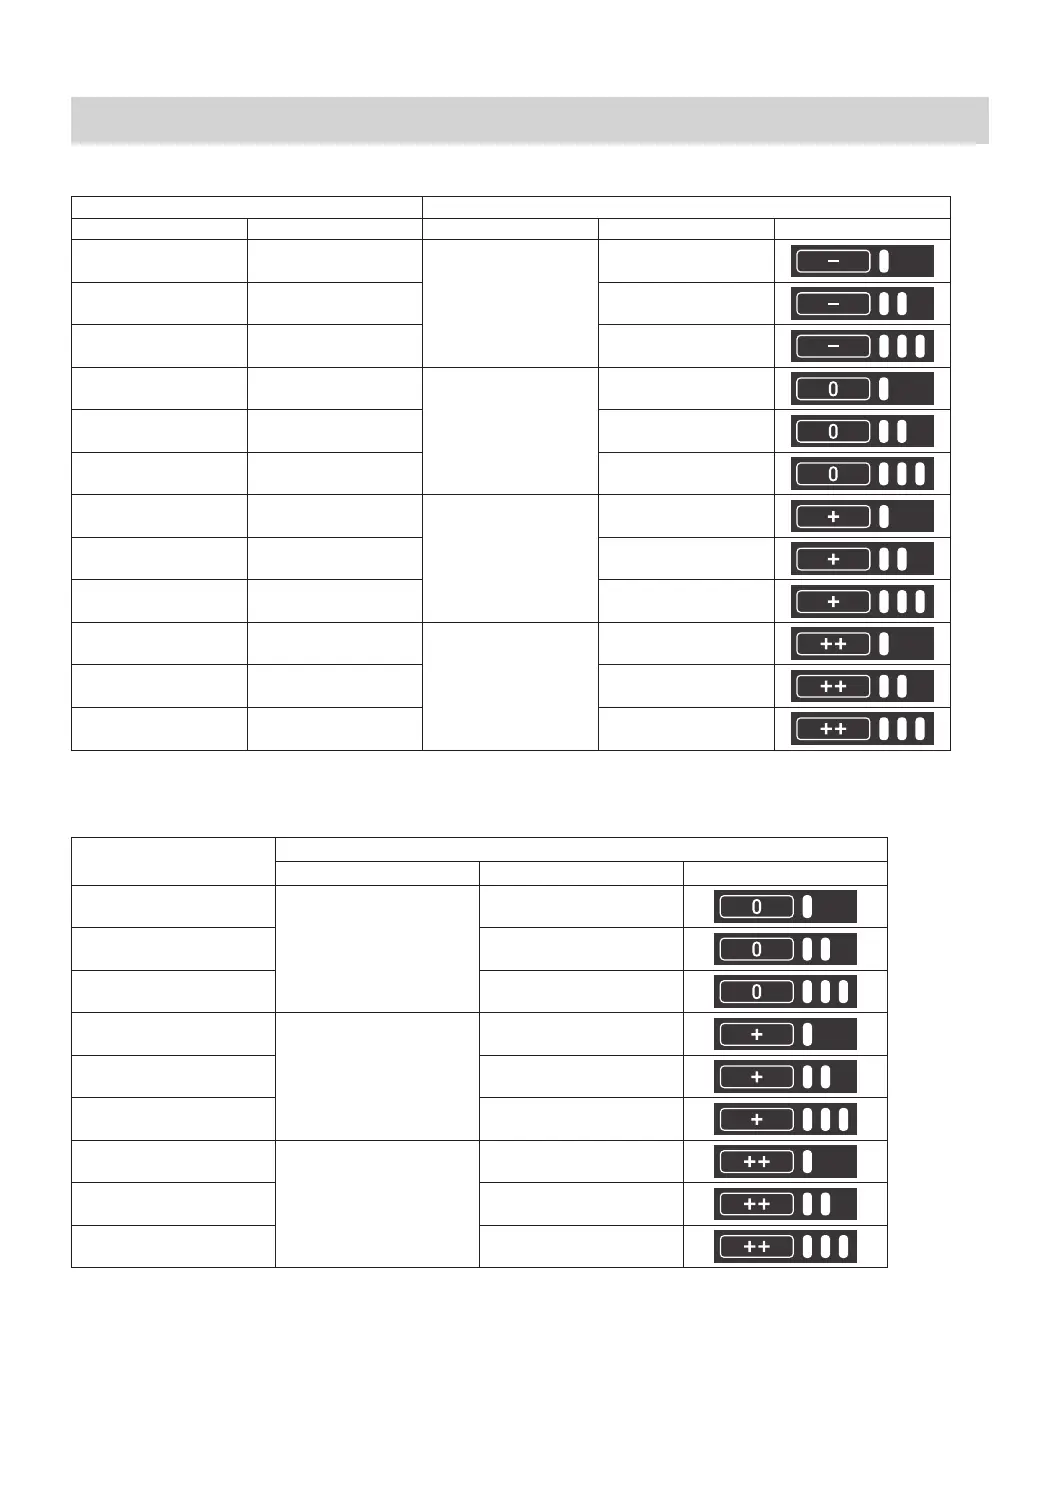
20. Measurement Results Interpretation Diagrams
Interpreting the Body Fat Percentage Result
Body Fat Percentage Classication
Male Female 4 Level 12 Level Display
5.0 ~ 6.6% 5.0 ~ 9.9%
– (Low)
1
6.7 ~ 8.3% 10.0 ~ 14.9% 2
8.4 ~ 9.9% 15.0 ~ 19.9% 3
10.0 ~ 13.2% 20.0 ~ 23.2%
0 (Normal)
4
13.3 ~ 16.5% 23.3 ~ 26.5% 5
16.6 ~ 19.9% 26.6 ~ 29.9% 6
20.0 ~ 21.6% 30.0 ~ 31.6%
+ (High)
7
21.7 ~ 23.3% 31.7 ~ 33.3% 8
23.4 ~ 24.9% 33.4 ~ 34.9% 9
25.0 ~ 33.3% 35.0 ~ 39.9%
++ (Very High)
10
33.4 ~ 41.7% 40.0 ~ 44.9% 11
41.8 ~ 50.0% 45.0 ~ 50.0% 12
Based on the obesity values proposed by Lohman (1986) and Nagamine (1972).
Interpreting the Visceral Fat Level Result
Visceral Fat Level
Level Classication
3 Level 9 Level Display
1 ~ 6
0 (Normal)
1
7 2
8 ~ 9 3
10 ~ 11
+ (High)
4
12 5
13 ~ 14 6
15 ~ 16
++ (Very High)
7
17 8
18 ~ 30 9
According to OMRON HEALTHCARE gures
 Loading...