EasyManuals Logo

Omron NA Series Practices Guide

Omron NA Series
69 pages
To Next Page IconTo Next Page
To Previous Page IconTo Previous Page
Page #60 background imageLoading...
Page #60 background image
60
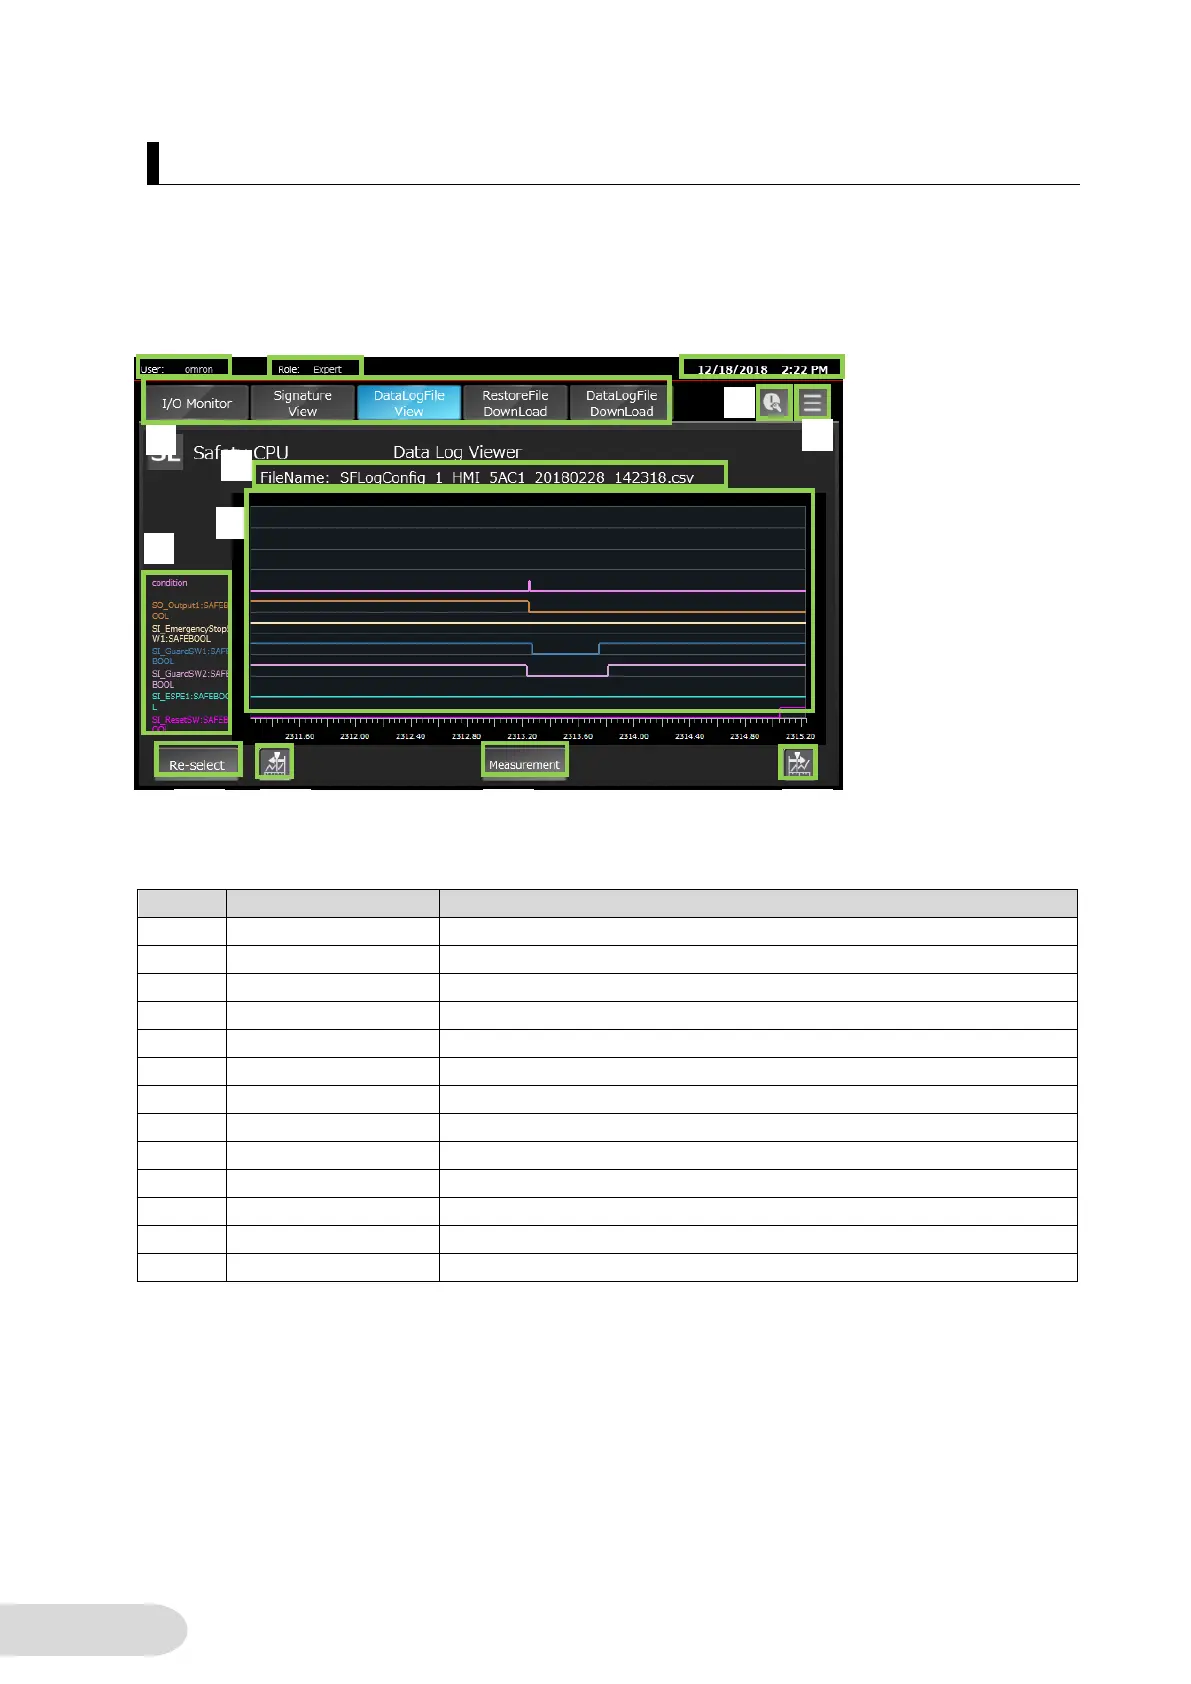
6-3-8 Data Log Display Screen
Data log of variables which selected in 6-3-7 Variable Selection Screen
Screen Layout
No
Part
Description
1
Data Display
Displays the user name who logging in.
2
Data Display
Shows the logging in users authority.
3
Data Display
Displays the current time.
4
Button
Switches to each Safety CPU Demo Screen.
5
Button
Switches to the Troubleshooter Screen of the connected controller.
6
Button
Switches to Menu Screen.
7
Data Display
Shows the selected data log file name.
8
Data Display
Displays the selected variable.
9
BrokenLineGraph
Indicates the data logging result of the selected variable.
10
Button
Switches to Variable Selection Screen.
11
Button
Left-scrolls through a graph of the data logging result.
12
Button
Right-scrolls through a graph of the data logging result.
13
Button
Switches to Measurement Screen.
1
2
3
4
9
5
6
7
8
11
12
13
10

Other manuals for Omron NA Series

Questions and Answers:

Question and Answer IconNeed help?

Do you have a question about the Omron NA Series and is the answer not in the manual?

Omron NA Series Specifications

General IconGeneral
Touch PanelResistive
InterfacesUSB, Ethernet, RS-232/422/485
Operating Temperature0°C to 50°C
Power Supply24 VDC
Protection RatingIP65 (front panel)
Storage Temperature-20°C to 60°C
Display TypeTFT LCD
DimensionsVaries depending on the model
WeightVaries depending on the model

Related product manuals