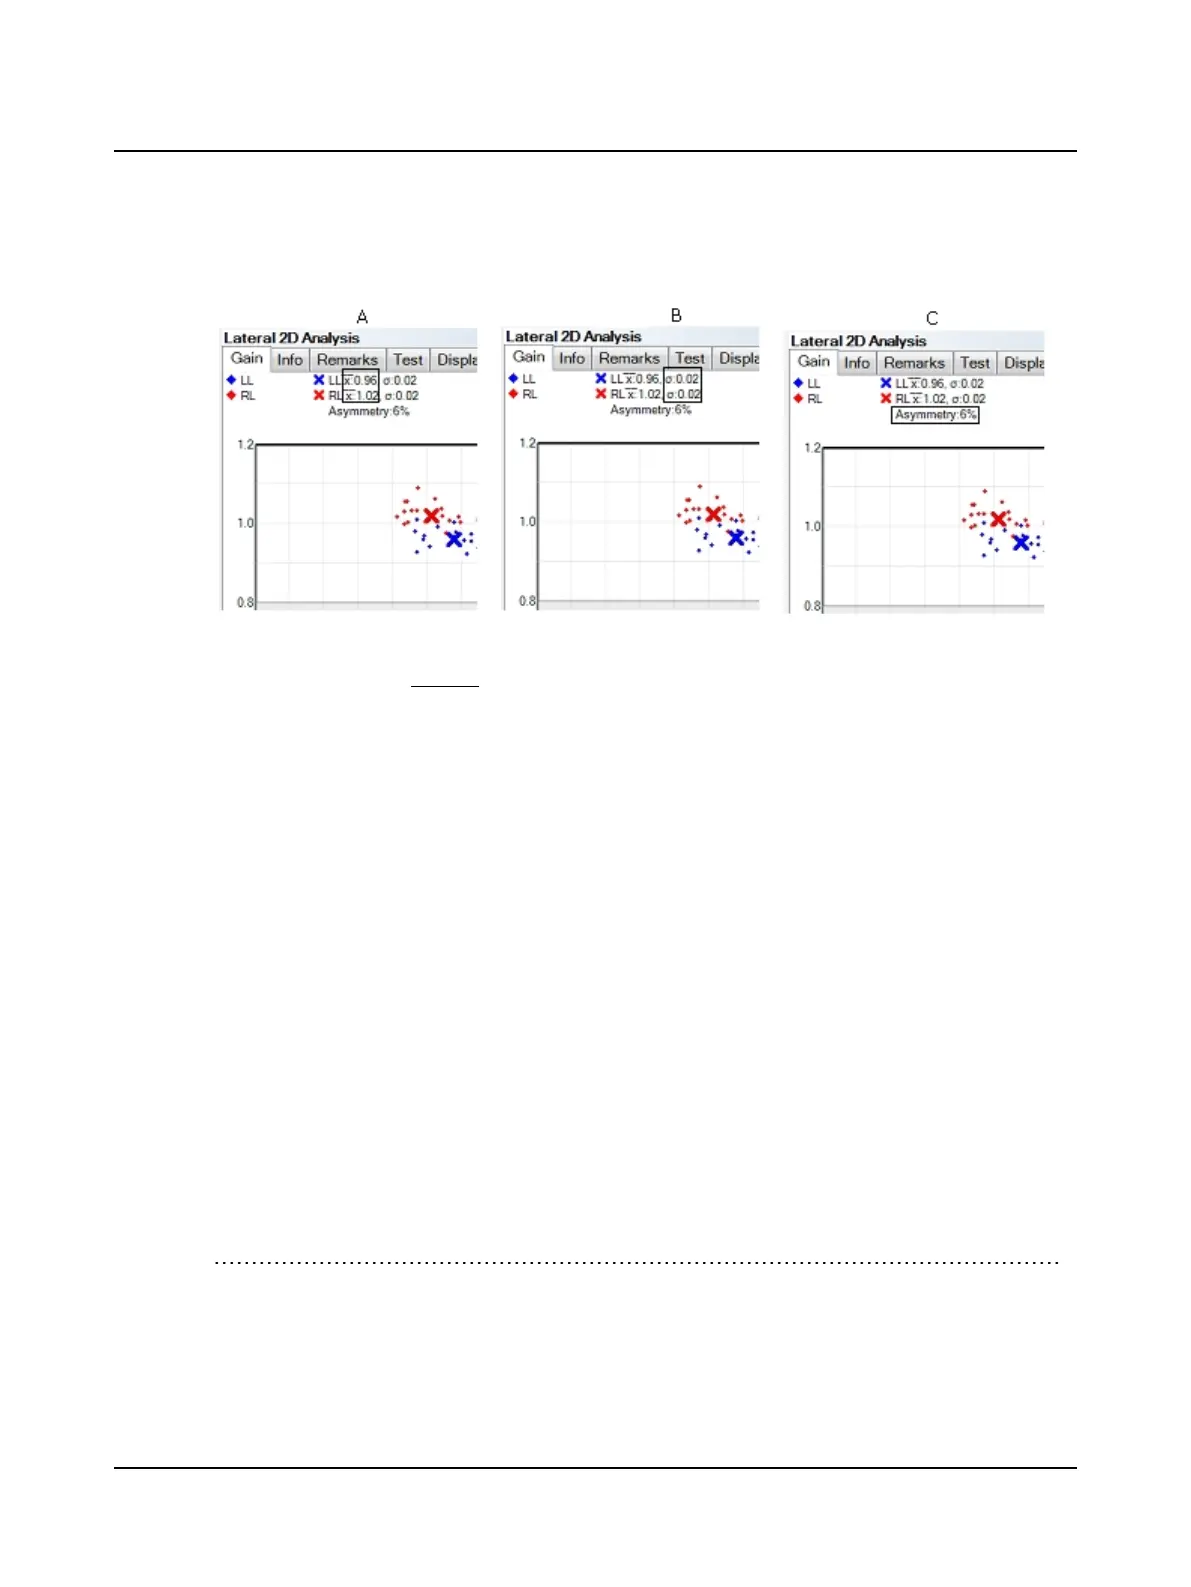
Displayed above the graph are the values for the right and left means (A), the right and left standard deviations (B), and
the asymmetry (C).
The method for calculating relative right-left vestibulo-ocular reflex asymmetry (the Asymmetry value) is as follows.
(1)
( )
xAsymmetry % = 1 − 100
lower gain
higher gain
The calculation is specific to the planes tested: Lateral (right lateral to left lateral) or LARP (left anterior to right pos-
terior) or RALP (right anterior to left posterior).
Normative data
Normative cutoff values are defined according to data research.
(2)
Shading indicates the boundaries for data outside of the normative cutoff values:
• Data in the white zone is within normal limits.
• Data in the light gray area indicates unilateral loss.
• Data in the dark gray area indicates bilateral loss.
To change the normative cutoff values, refer to the Reference Manual.
Age-based normative data
Age-based normative cutoff values are defined as the mean ± 2 standard deviations for the age range 10 to 99 years.
On the gain graph, an outline defines the area inside of which the data is considered within normal limits.
(1)
Newman-Toker DE, Saber-Tehrani AS, Mantokoudis G, Pula JH, Guede CI, Kerber KA, Blitz A, Ying SH, Hsieh YH, Roth-
man RE, Hanley DF, Zee DS, Kattah JC. Quantitative video-oculography to help diagnose stroke in acute vertigo and dizzi-
ness: toward an ECG for the eyes . Stroke.2013;STROKEAHA.111.000033.
(2)
MacDougall HG, Weber KP, McGarvie LA, Halmagyi GM, Curthoys IS (2009) The video head impulse test: Diagnostic
accuracy in peripheral vestibulopathy. Neurology 73 (14): 1134-1141.
60 Otometrics - ICS Impulse USB
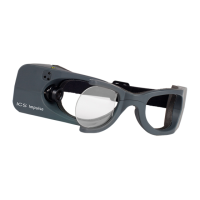
9 Head Impulse