9.11 3D Analysis window
Default colors for data shown in the graphs allow those who are color blind to easily distinguish the different colors. To
change the colors used for each type of data, click the Graph Colors window tab in the Options window. Refer to the
Reference Manual.
The default layout places the right graph (right head and eye velocity data) on the right and the left graph (left head and
eye velocity data) on the left. To switch the layout, click the Head Impulse window tab in the Options window and select
Display Left Graph on Right Side. Refer to the Reference Manual.
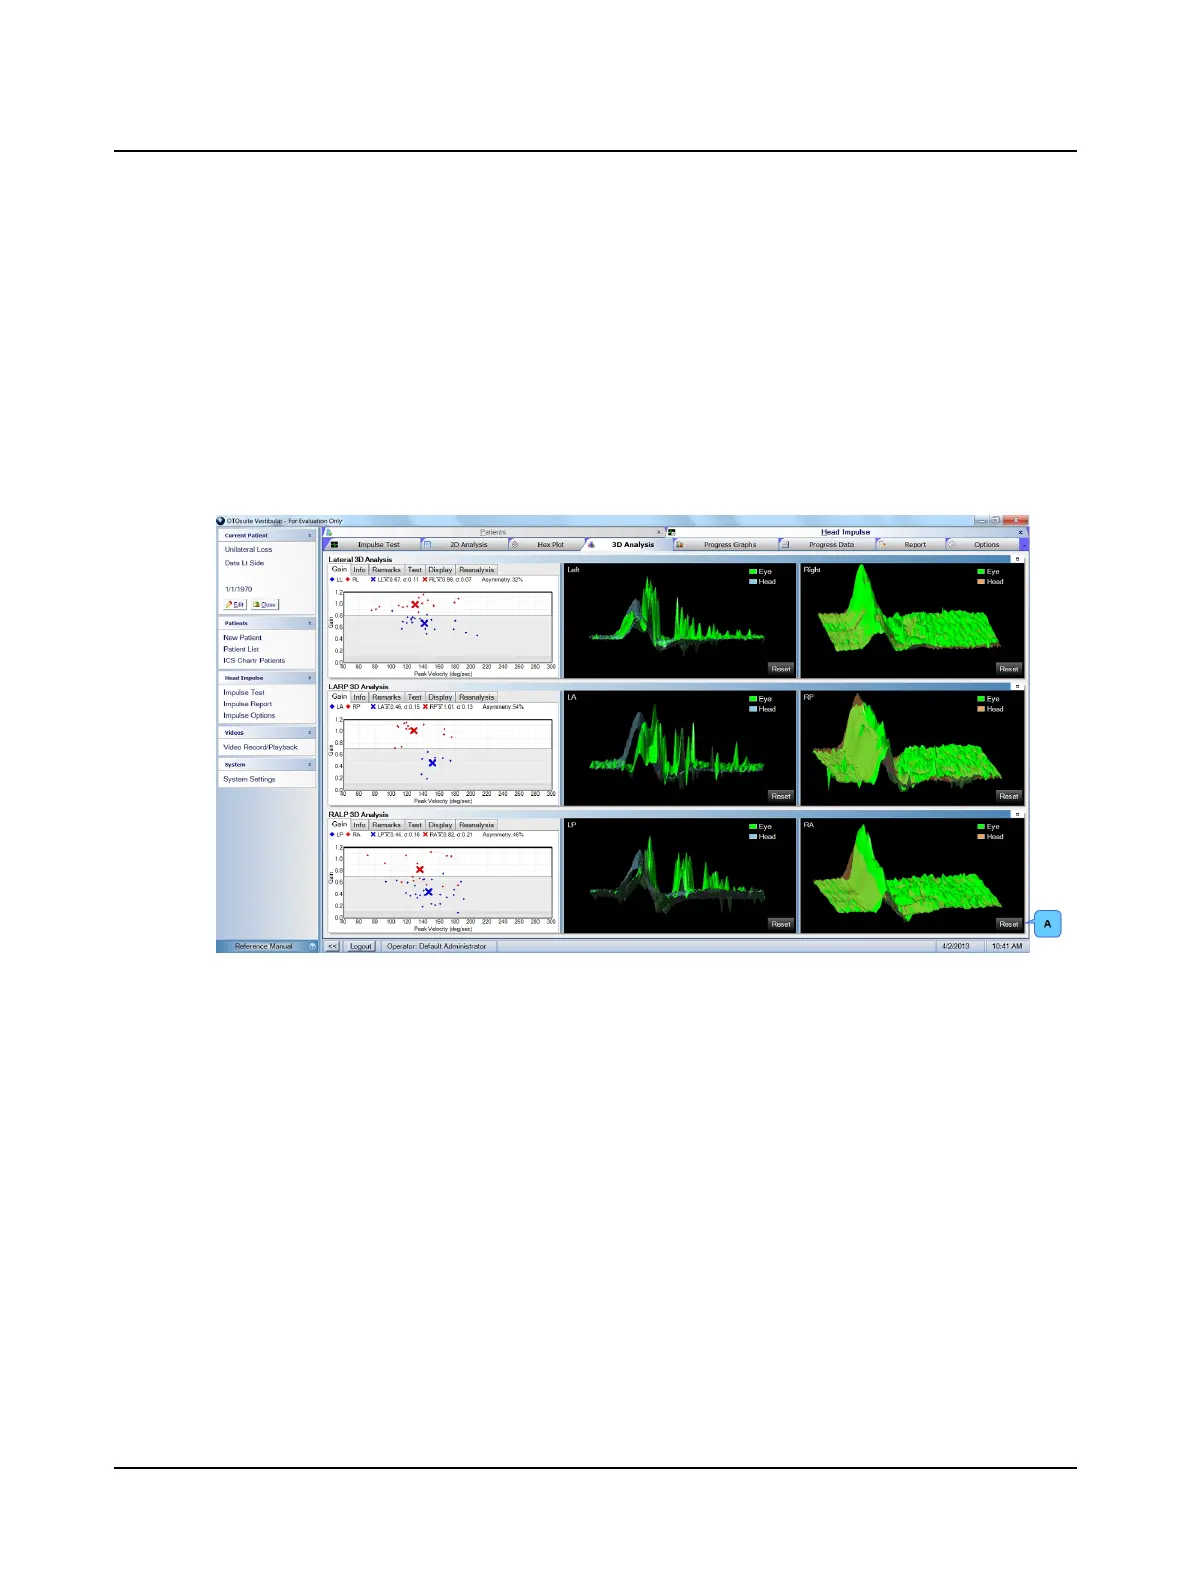
The data can be viewed from 360 degrees. To see the data from different views, hold down left-mouse button and rotate
as desired. To return the data to the original view, click Reset (A).
Otometrics - ICS Impulse USB
69
9 Head Impulse
 Loading...