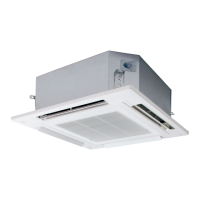
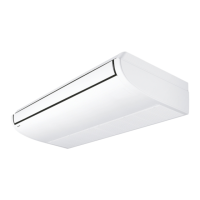
1-5-1
11 11
PZ3
U-36PZ3E5 (For 50 Hz)
1-5. Capacity Correction Graph According to Temperature Condition
Input coefficient (%) Capacity coefficient (%)
Input coefficient (%)
Outdoor air intake temp ( °C DB)
Capacity coefficient (%)
Outdoor air intake temp ( °C WB)
Cooling capacity ratio (maximum capacity) Heating capacity ratio (maximum capacity)
Indoor air intake temp (°C DB)
Indoor air intake temp (°C DB)
Indoor air intake temp (°C WB)
Indoor air intake temp (°C WB)
20
40
60
80
100
120
140
160
20
40
60
80
100
120
140
160
20
40
60
80
100
120
140
160
20
40
60
80
100
120
140
160
Outdoor unit heating capacity correction cofficient during of frosting/defrosting
Outdoor intake air
temperature °C WB
-15 -14 -13 -12 -11 -10 -9 -8 -7 -6 -5 -4 -3 -1 0 1 2 3 4 5
Correction coefficient
6
0.933
-16
0.935 0.882
-2
0.876 0.876 0.892 0.907 0.923 0.938 0.954 0.969 0.985 1.0000.8880.8940.9010.9070.9130.9190.9250.9270.9290.931
To calculate the heating capacity with consideration for frosting/defrosting operation, multiply the heating capacity
found from the capacity graph by the correction coefficient from the table above.
-15 -5 5 15 25 35 45 -20 -15 -10 -5 0 5 10 15 20
24°C
20°C
16°C
24°C
20°C
16°C
22℃
19℃
16℃
22°C
19°C
16°C
SM830283-00_欧州向け R32シングル36-71形TD&SM.indb 1 20/01/30 10:24:45
 Loading...
