Parker Hannifin
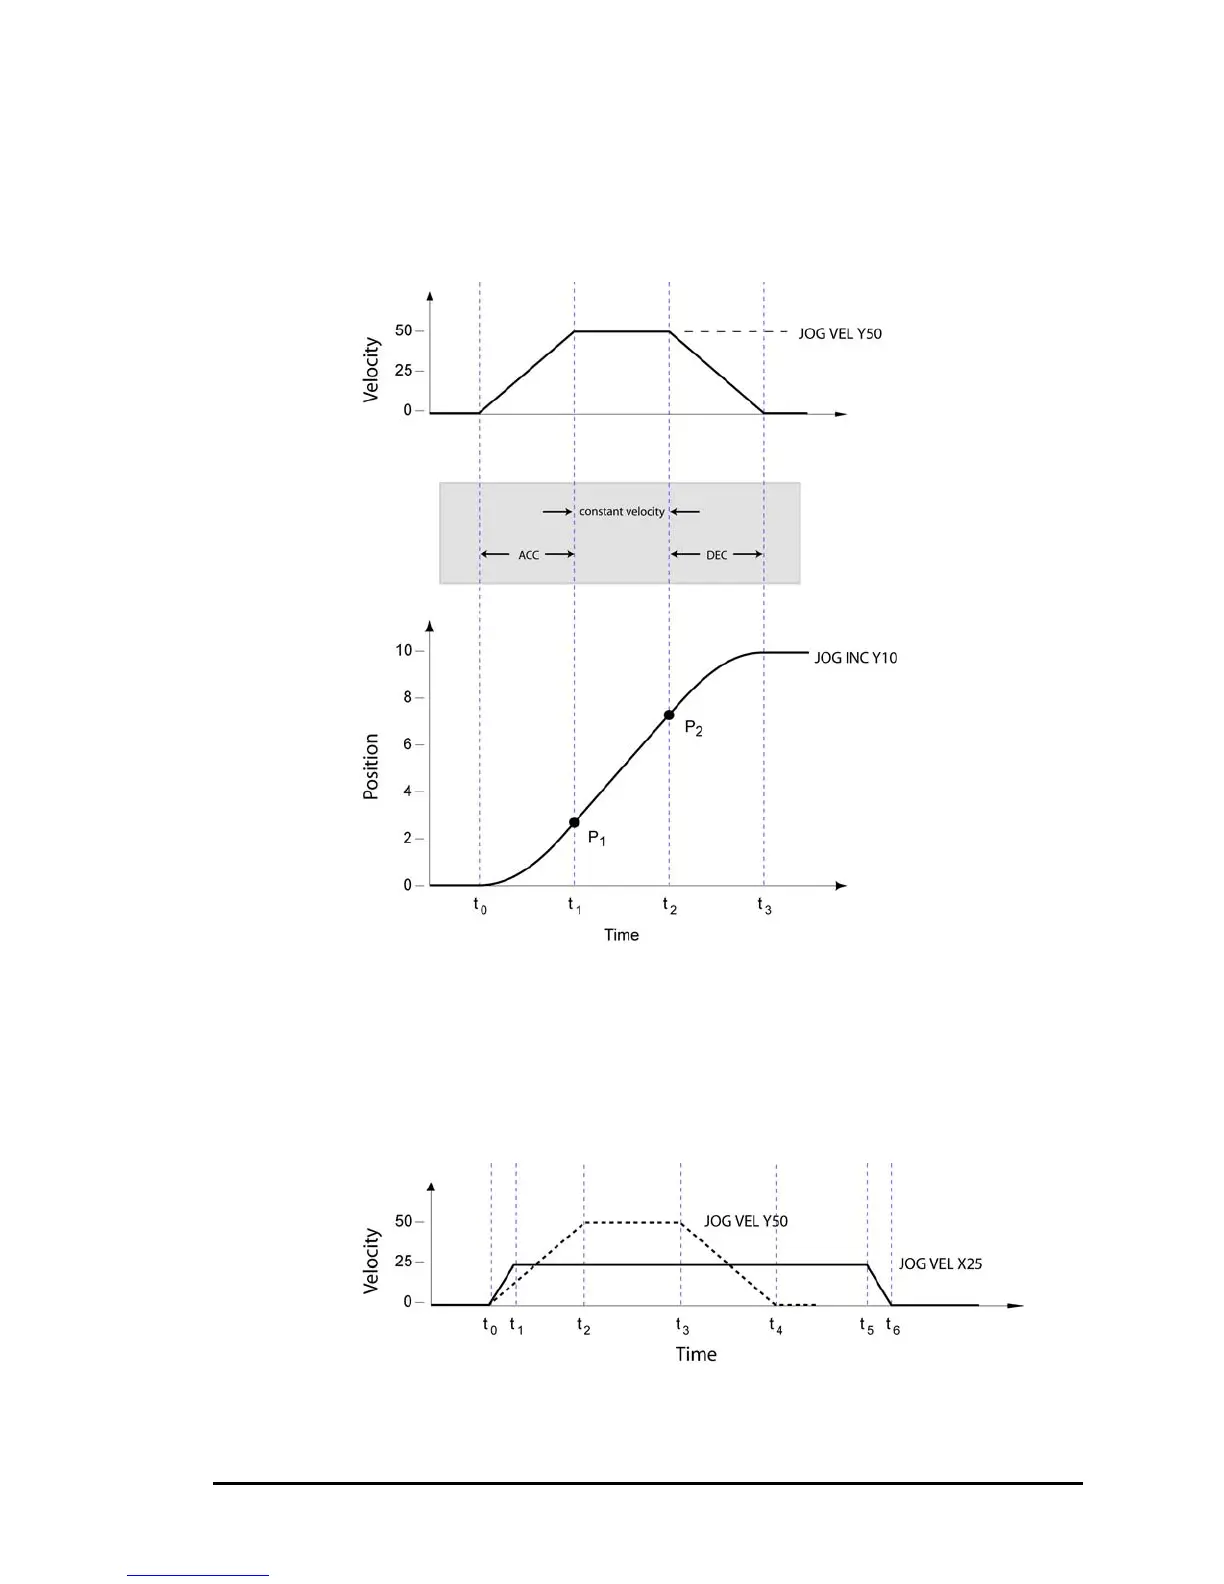
Figure 5 looks at the movement for the Y axis, characterized by more gradual
slopes for acceleration and deceleration values of 500 in the velocity motion
profile (as compared to the X-axis’ values of 1000).
Figure 5 Y-Axis Velocity and Position Profiles
Again, the straight line between points P
1
and P
2
on the position motion profile is
where the Y-axis movement is a constant velocity.
Figure 6 shows the velocity motion profiles for both the X and Y axes
superimposed. The Y axis is dashed. Due to a higher JOG VEL value, the Y axis
finishes its commanded motion in less time than the X axis.
Figure 6 X and Y Velocity Motion Profiles
68 Programmer’s Guide
 Loading...