13900-103 Rev. A Page 27
Fire Around
The Fire Around is a test which performs an alignment test
of the optical system of the AT550. This test measures the
optical alignment at the center of the test eye and then at
eight equidistant points around the center of the eye.
From the data (graphs) provided by this test, adjustment
can be made to correct the optical alignment
1. From the Services Menu screen, press the button
below the DOWN icon to highlight the Fire test, then
press the button below the SELECT icon. The Fire
Around Menu will be active.
CAUTION: USE ONLY A 13717 CALIBRATED RUBBER EYE
FIXTURE WHICH HAS BEEN VERIFIED FOR
ACCURACY AT THE REICHERT FACTORY WITHIN
THE LAST 6 MONTHS OR INCORRECT CALIBRA-
TION MAY RESULT.
2. Install your calibrated set of rubber eyes onto the
rubber eye stand and align the middle rubber eye in
front of the air-puff nozzle approximately 0.5 to 1.0
inches (1.3 to 2.5 cm) from the end of the nozzle.
Refer to Figure CT-8.
3. Press the button below the RIGHT arrow to select the
digit which requires modification. Press the button
below the + icon until the value is 2.0 steps. Press the
button below the MEASURE icon.
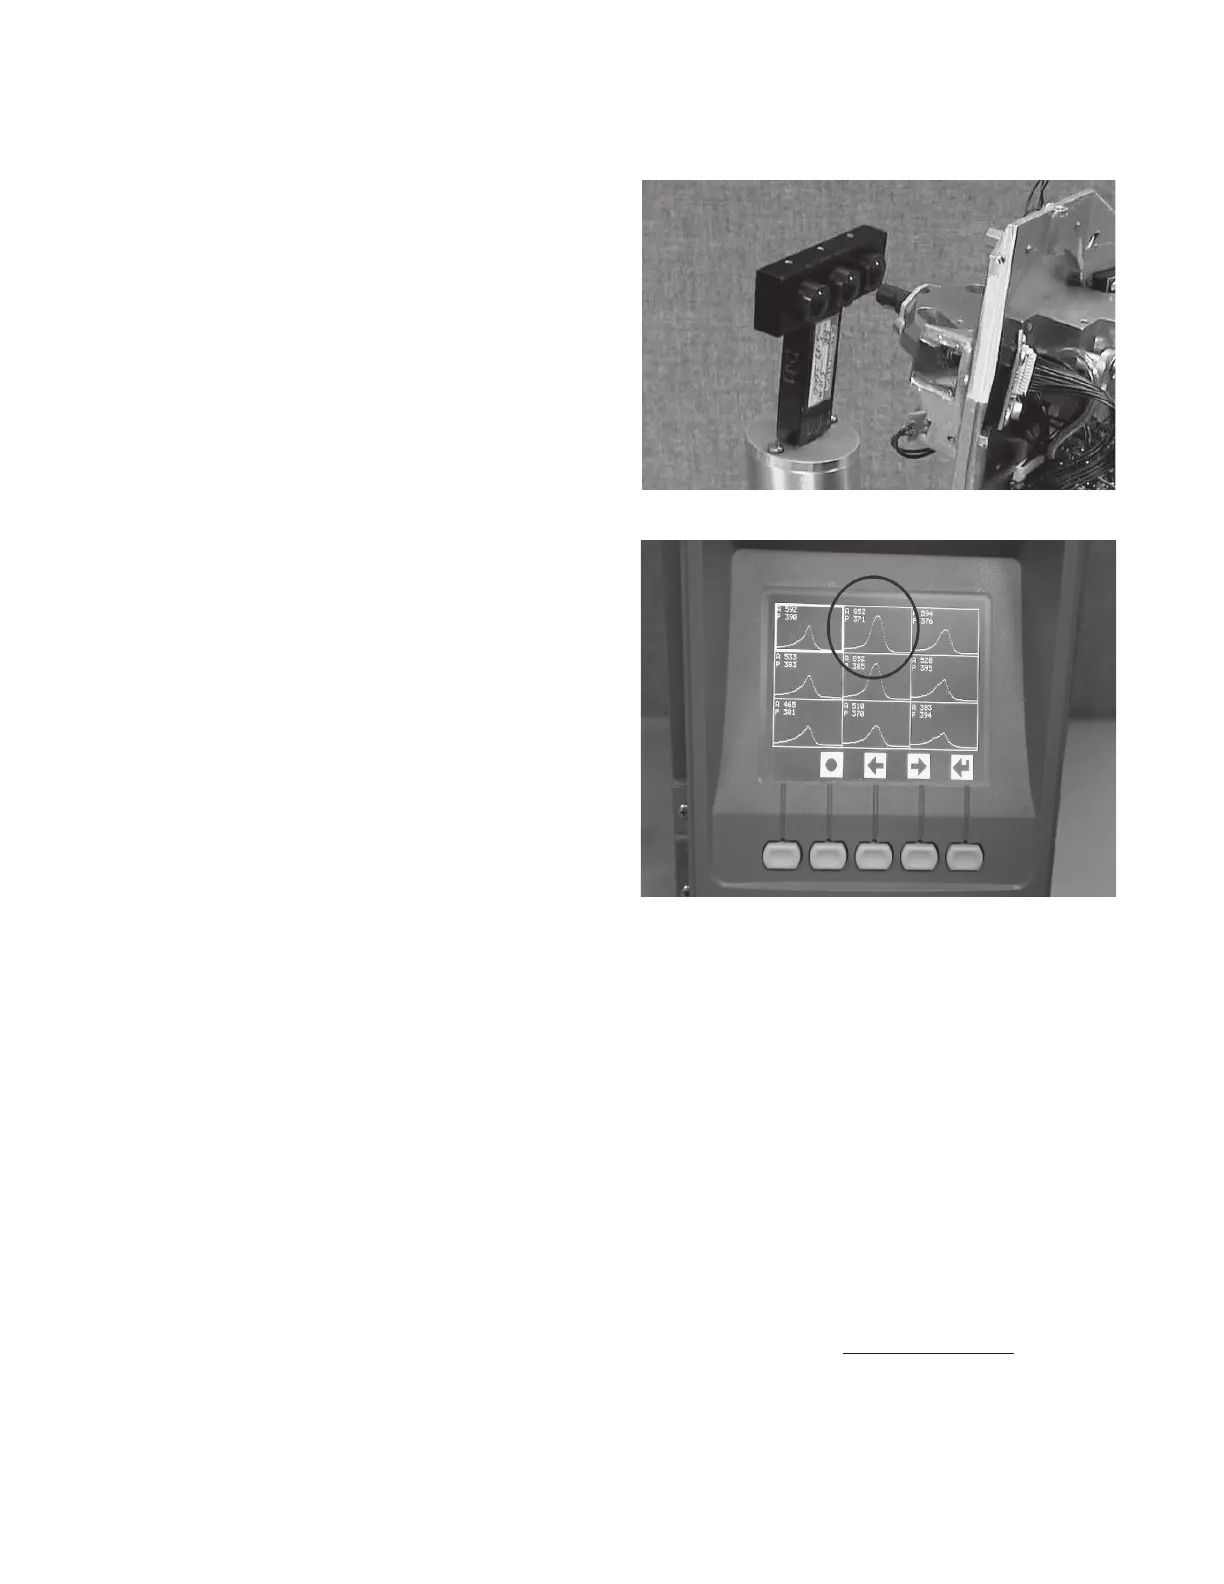
4. The AT550 will take nine measurements and then
display nine graphs. Use the LEFT and RIGHT arrows
and highlight the graph which is symmetrical and has
the highest peak amplitude (A). Press the button
below the SELECT icon to save the graph position to
memory. Refer to Figure CT-9.
Note: If you chose a graph other than the center graph,
press the button below the MEASURE icon to
repeat the 2.0 step test.
Note: You may have asterisk readings displayed during
this part of the test. This is normal when the
amplitude of one of the graphs is low.
5. Press the button below the RIGHT arrow to select the
digit which requires modification. Press the button
below the – icon until the value is 1.0 steps. Press the
button below the MEASURE icon.
6. Use the LEFT and RIGHT arrows to highlight the graph
which is symmetrical and has the highest peak
amplitude (A). Refer to Figure CT-9. Press the button
below the SELECT icon to save the graph position to
memory.
Note: If you chose a graph other than the center graph,
press the button below the MEASURE icon to
repeat the 1.0 step test.
7. Press the button below the RIGHT arrow to select the
digit which requires modification. Press the button
below the – icon until the value is 0.8 steps. Press the
button below the MEASURE icon.
8. Use the LEFT and RIGHT arrows to highlight the graph
which is symmetrical and has the highest peak
amplitude (A). Refer to Figure CT-9. Press the button
below the SELECT icon to save the graph position to
memory.
Note: If you chose a graph other than the center graph,
press the button below the MEASURE icon to
repeat the 0.8 step test.
Note: The peak amplitude value (A) of the center graph
must be between 700 and 800. If it is not, in-
crease or decrease the applanation gain as
indicated in the Tonometer Alignment test and
then perform this test again.
9. When the center graph is symmetrical and has the
highest peak amplitude (A), press the button below
the RETURN icon to return to the Services Menu.
10. Keep the rubber eyes in position for the next test.
Figure CT-9. Selection of Applanation Graph
Figure CT-8. Rubber Eye Fixture
Calibration (Continued)
 Loading...