10
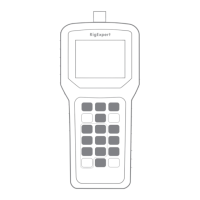
4.5.1. SWR graph
In the SWR graph mode (press the 4 key in the Main menu), values of the Standing
Wave Ratio are plotted over the specified frequency range:
You may set the center frequency (the 2 key) or scanning range (the 3 key). By using
arrow keys, these parameters may be increased or decreased.
Press the ok key to refresh the graph.
AA-54 only: the 0 key opens a list of radio amateur bands to set the required center
frequency and scanning range quickly. Also, you may use this function to set the whole
frequency range supported by the analyzer.
Press the 1 key to access a list of additional commands for this mode.
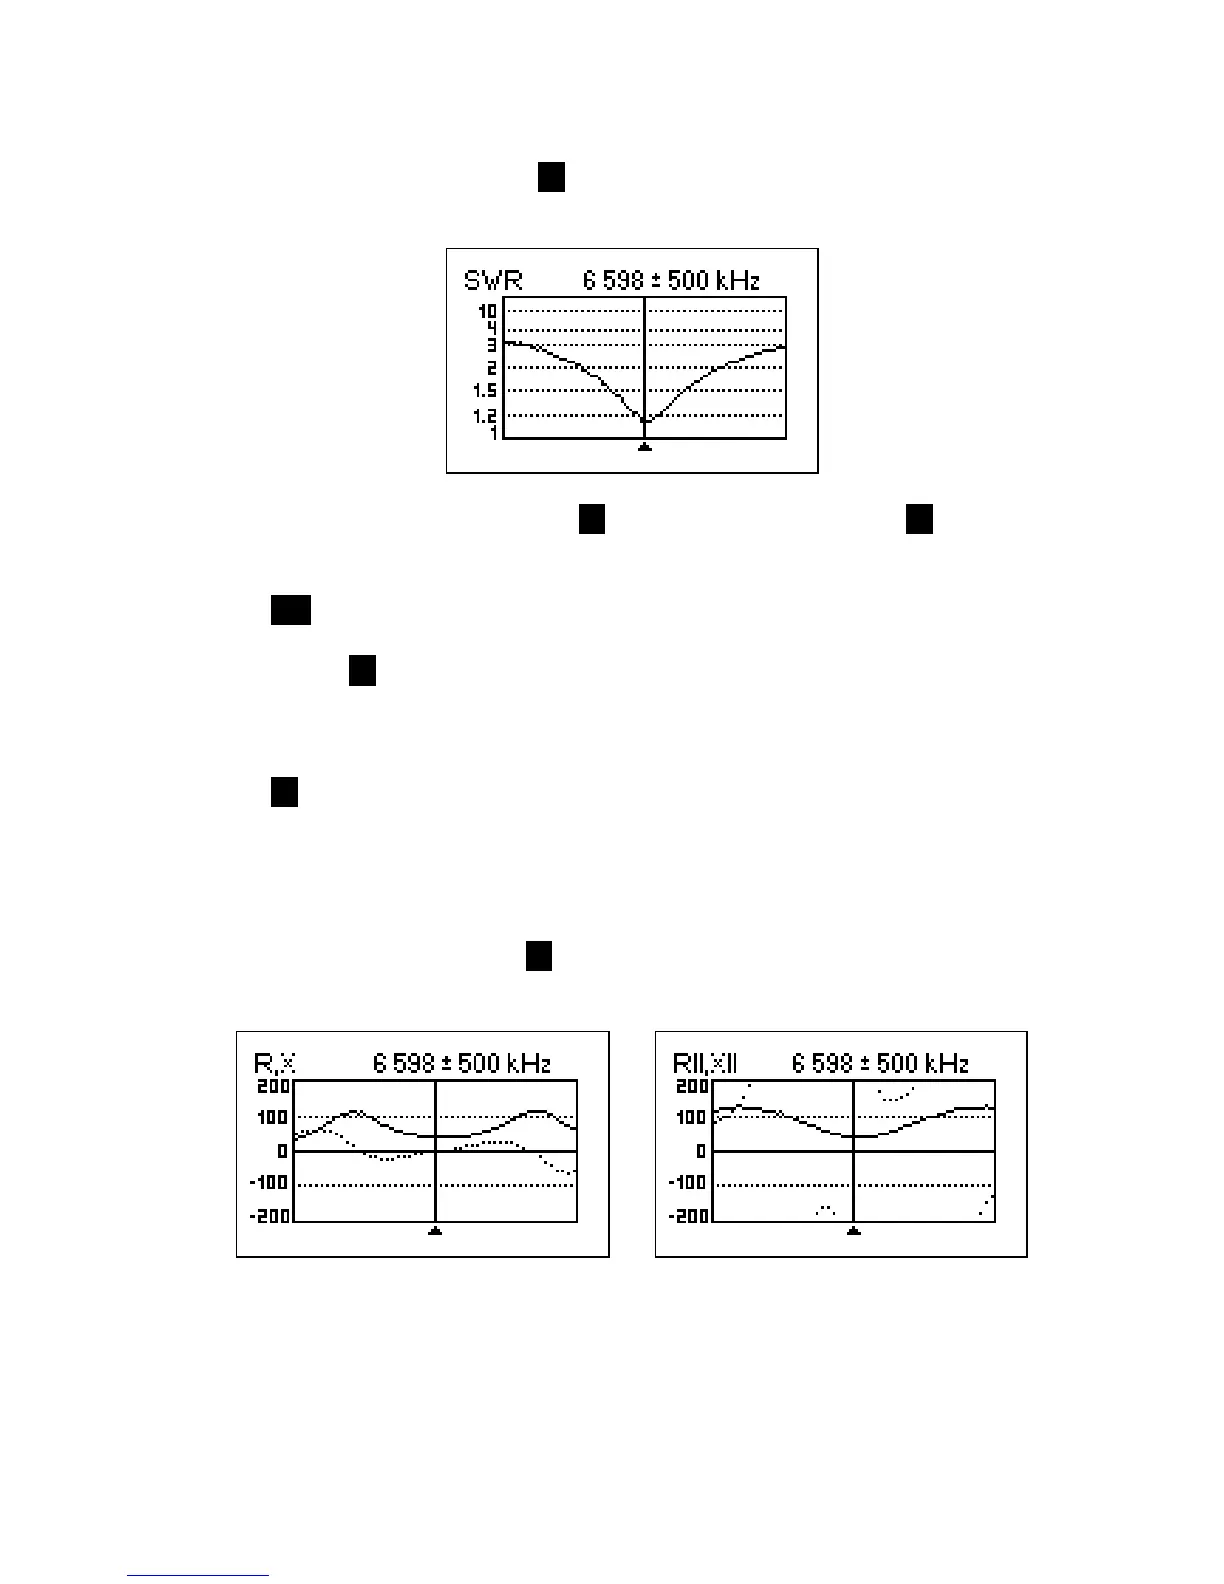
4.5.2. R,X graph
In the R,X graph mode (press the 5 key in the Main menu), values or R (active part of
the impedance) and X (reactive part) are plotted as solid and dotted lines, respectively.
R,X graph – series model R||,X|| graph – parallel model
In these graphs, positive values of reactance (X) correspond to inductive load, while
negative values correspond to capacitive load. Please notice the difference in the plots
when the series or parallel model of impedance is selected through the Settings menu.