RigExpert AA-35 ZOOM
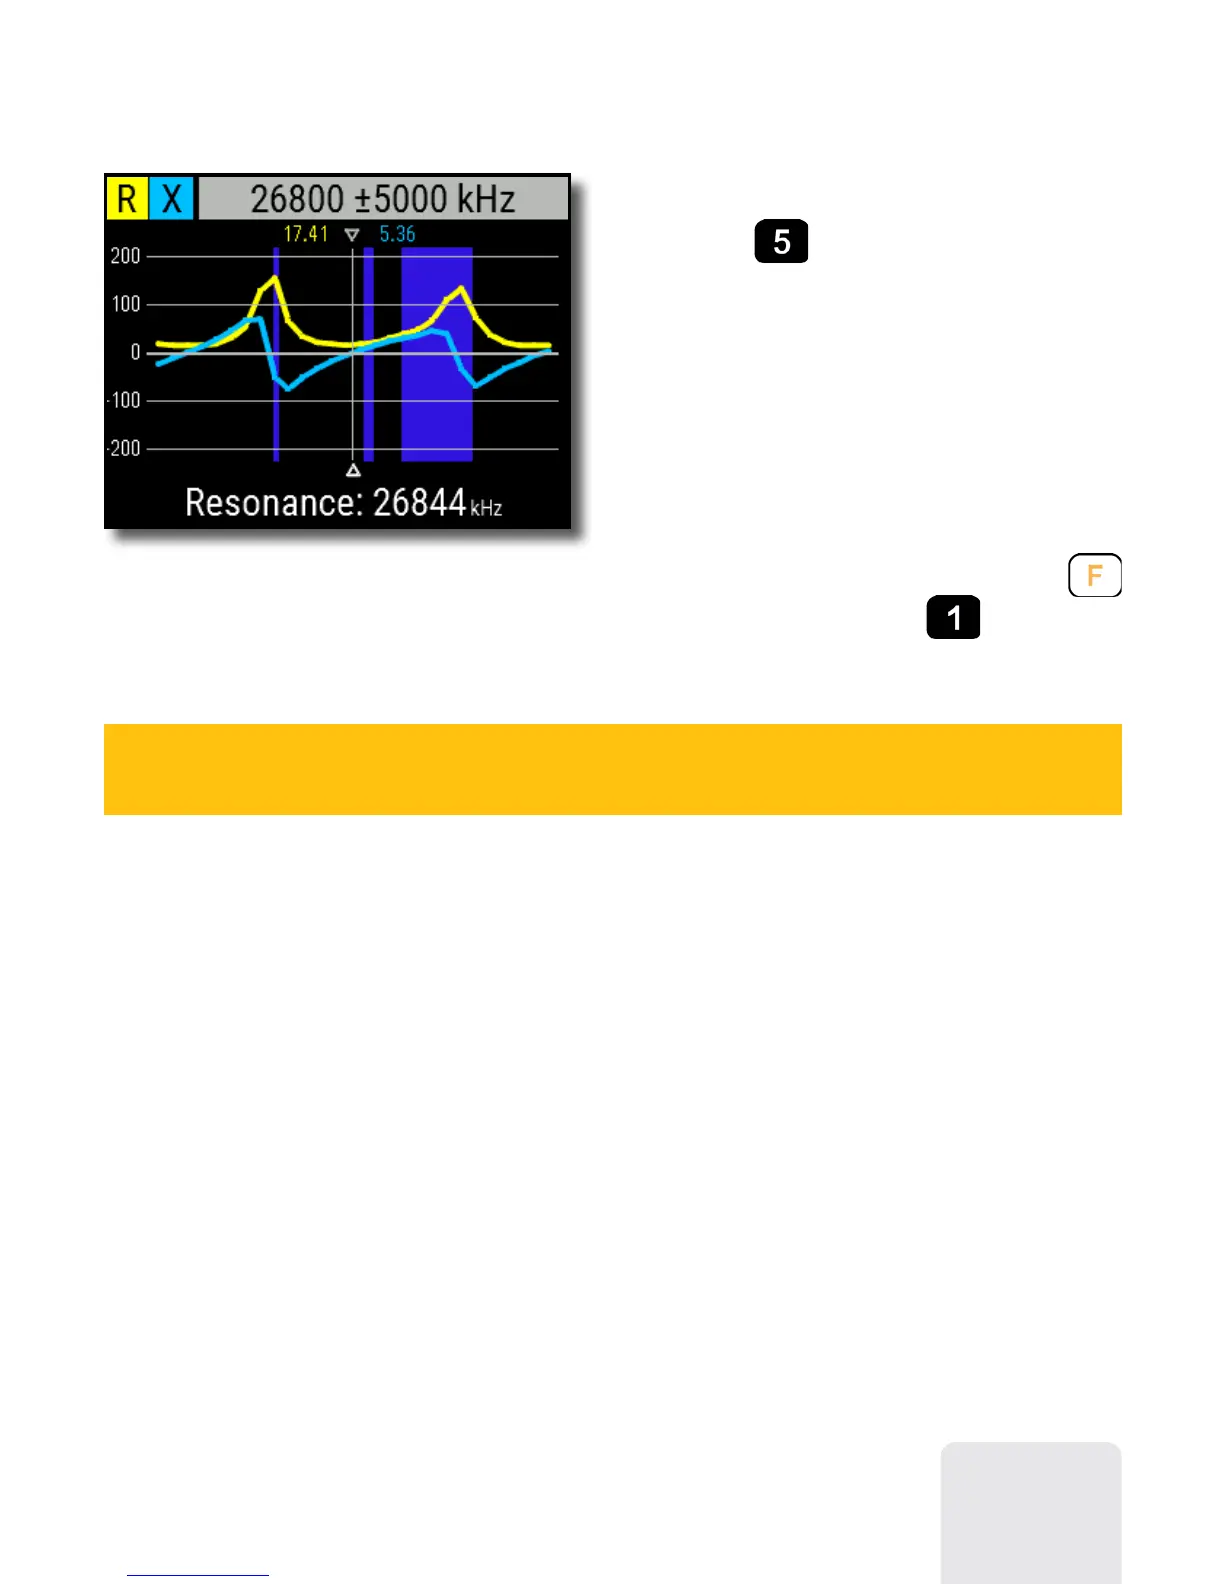
R,X chart
Press the
(R,X chart) key in the Main
menu to access the R,X chart mode.
Positive values of reactance (X)
correspond to inductive load, while
negative values correspond to capacitive
load.
The chart will display R and X for series
or parallel models of a load. Press
(Functional key) and to switch
between these models.
The marker at the bottom of the screen shows a resonant
frequency closest to the center of the scan.
9