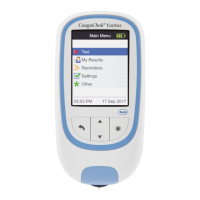
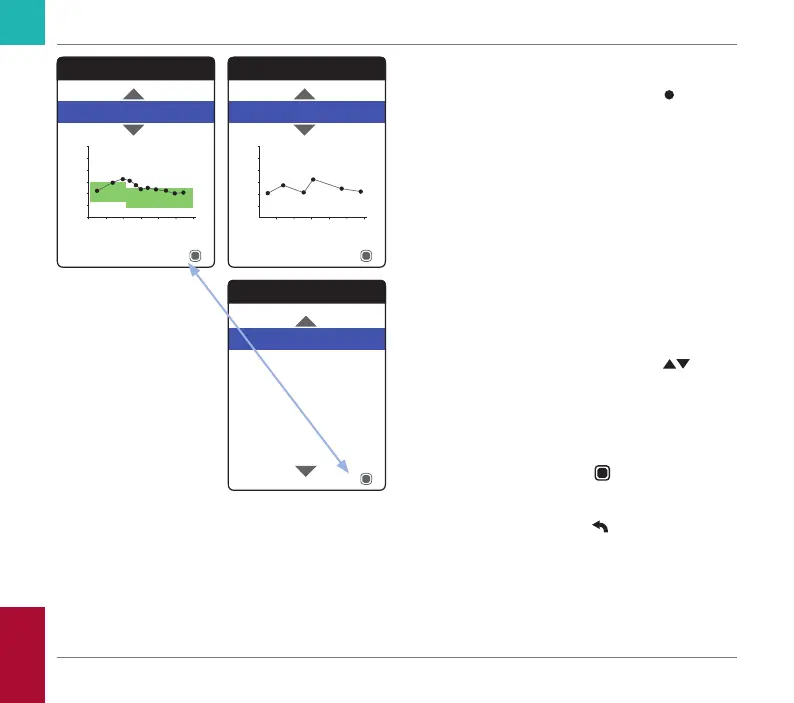
60
Graph view:
Each test result (represented by the
symbol)
is plotted along the time axis according to the
time when the test was performed. All test
results are connected by a line.
The green shading behind the line shows the
INR target range valid at that point in time (if
set, otherwise not displayed).
Table view:
The test results are shown in a list. The oldest
date is shown at the bottom and the most
recent date at the top.
5 Use the up/down arrows button
to
select the time period you want. Starting
from your most recent test result, you can
choose a time period going back 60, 90,
120, or 180 days.
6 Press the Enter button
to toggle
between graph and table display.
7 Press the Back button
to return to the
My Results menu.
Trend
90 Days
Table
Time
Average: 2.5 INR
INR
Trend
90 Days
Table
Time
Average: 2.5 INR
INR
Trend
Graph
2.8 INR
2.4 INR
2.9 INR
2.9 INR
2.6 INR
19 Jul 2018
05 Jul 2018
29 Jun 2018
22 Jun 2018
15 Jun 2018
12 Jul 2018
2.5 INR
Reviewing and Handling Data
CoaguChek Vantus User’s Manual, version 1.0