73
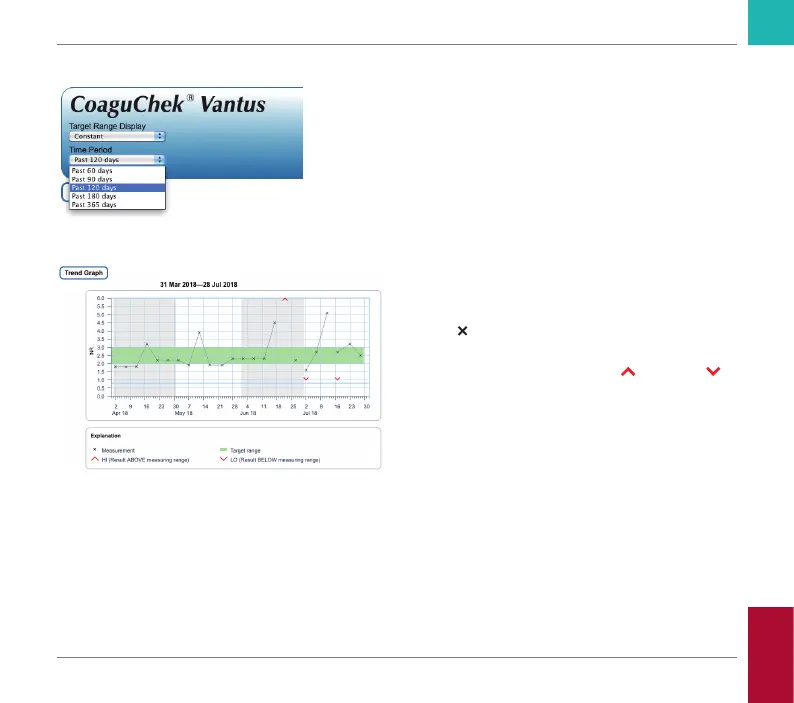
Time period
Starting from your most recent test result, you
can choose a Time Period going back 60, 90,
120, 180, or 365 days. This setting is applied
to both the Trend and Target graph.
Trend graph
All test results stored within a selected period
of time will be displayed in the chart as
linear values. Each test result (represented
by the
symbol) is plotted along the time
axis according to the time when the test was
performed. Test results above
or below
the measuring range are marked accordingly.
All test results are connected by a line in
chronological order.
Vertical lines on the Trend graph mark the
beginning of each week.
Reviewing and Handling Data
CoaguChek Vantus User’s Manual, version 1.0