74
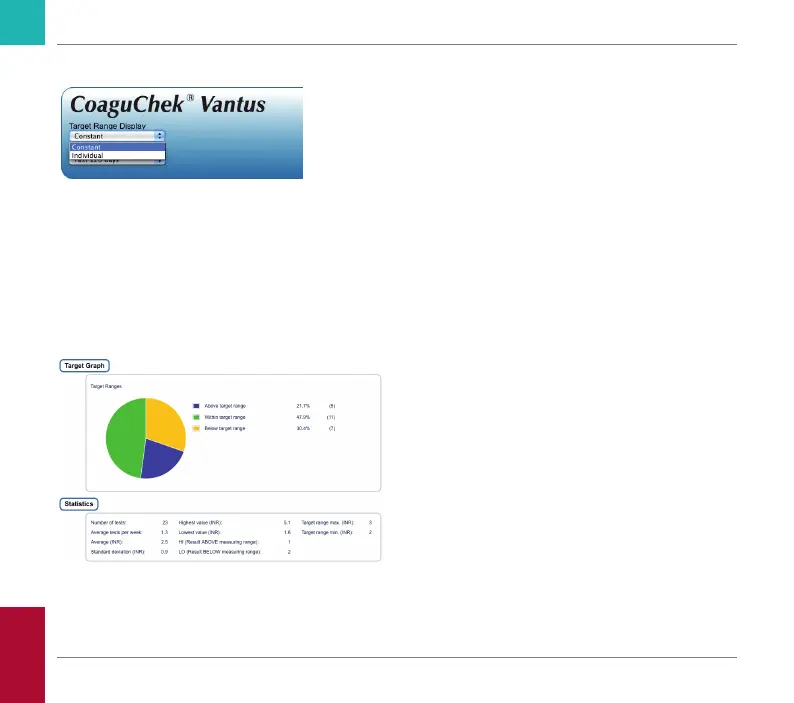
Target range display
The green shading behind the line shows
the INR target range (if set, otherwise not
displayed). You may set the Target Range
Display to:
• Constant: the current target range set in
the meter is applied to all results in the
selected time period.
• Individual: the green bar shows the target
range valid at that point in time.
Target graph
The percentage of values above, within and
below the set target range will be displayed
as a pie chart. The average (numerical) value
and the total number of results in that range
are also displayed.
Below the Target graph you will nd further
statistical information calculated from all
values within the selected time period.
Reviewing and Handling Data
CoaguChek Vantus User’s Manual, version 1.0