Rointe efficient heating · 19
Rointe Connect App user manual
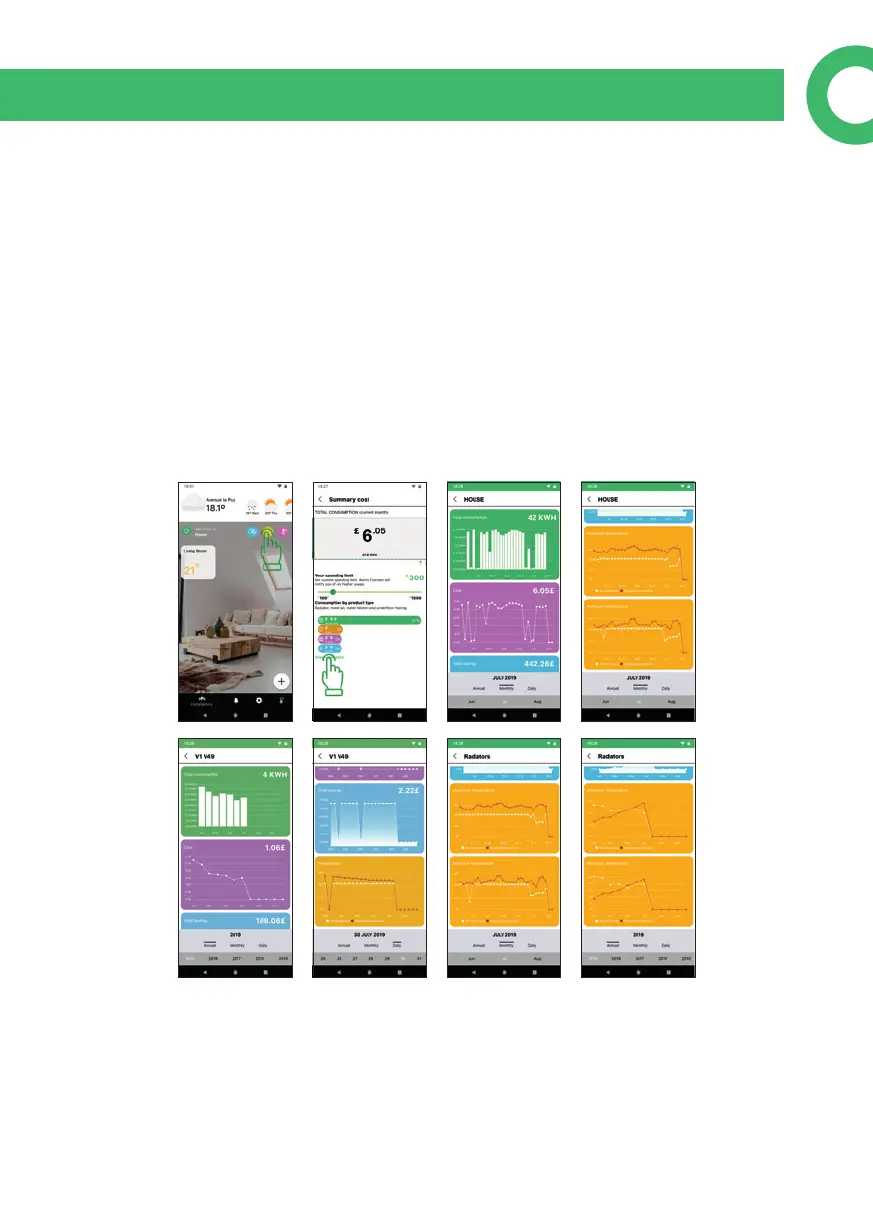
12. STATISTICS
Statistics can be viewed by complete installation, by zone, subzone, or device. You
must have congured the electricity tari to be able to access the statistics. If the
tari is changed, the cost data is updated from the change, the previous ones do
not change. The products send statistics once every hour to the app as long as they
are connected or paired. To access the general statistics of the installation, press the
statistics button from the main screen. There will be a summary and you can change
the limit of monthly expenditure using the slider and access the details by clicking
on "view statistics". To see the specic statistics of a zone or device, go to the screen
of the zone or device and press the statistics button. You can see Total Consumption
in KWh, Cost, Savings, Maximum and Minimum temperature (for annual and mon-
thly data) and temperature (for daily data).