58
Data Output Functions
There are 3 options for data output:
– Output to the display/control unit
– Output to a printer (generate a printout)
– Output to a peripheral device (e.g., computer) via the interface port
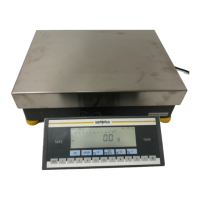
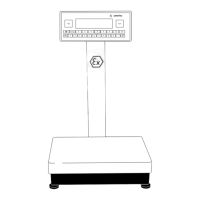
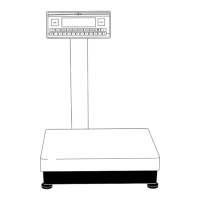
Output to the Display and Control Unit
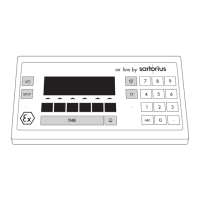
The display is divided into 6 sections:
– Line for metrological data
– Bar graph
– Measured value line
– Weight unit display
– Symbol display
– Text line
Line for Metrological Data (when used as a legal measuring instrument)
This line shows:
– Maximum scale capacity (e.g., 6,200 g)
– Minimum scale capacity; the weight must not go below this limit when
the scale is used in legal metrology
– Verification scale interval of the scale; irrelevant if the scale
is not used in legal metrology (e.g., 0.1 g)
– Readability: Indicates the actual scale interval
(display increment of the scale) (e.g., 0.01 g)
Bar graph
In the bar graph, weighing results are displayed either
– as a percentage of the maximum
scale capacity, or
– in relation to a target value,
with tolerance limits indicated.
Measured Value Line
This line displays:
– The current weight readout
(digits bordered with a broken line are invalid in use for legal metrology)
– Information on the scale and display and control unit
(e.g., version numbers)
– Data entered by the user (e.g., lot number)
Max
6200
g
Min
0.5
g
e =
0.1
g
d =
0.01
g
1234.56
01-31-18
-96-Abc1