MANUAL DE INSTRUCCIONES CODIGO 80342 REV O 11/2021 Pag.: 53
J.P. SELECTA s.a.u. Autovía A-2 Km 585.1 Abrera 08630 (Barcelona) España Tel 34 937 700 877 Fax 34 937 702 362
e-mail: selecta@jpselecta.es - website: http://www.grupo-selecta.com
10. Creating a Graph
Use Excel to read the logs.
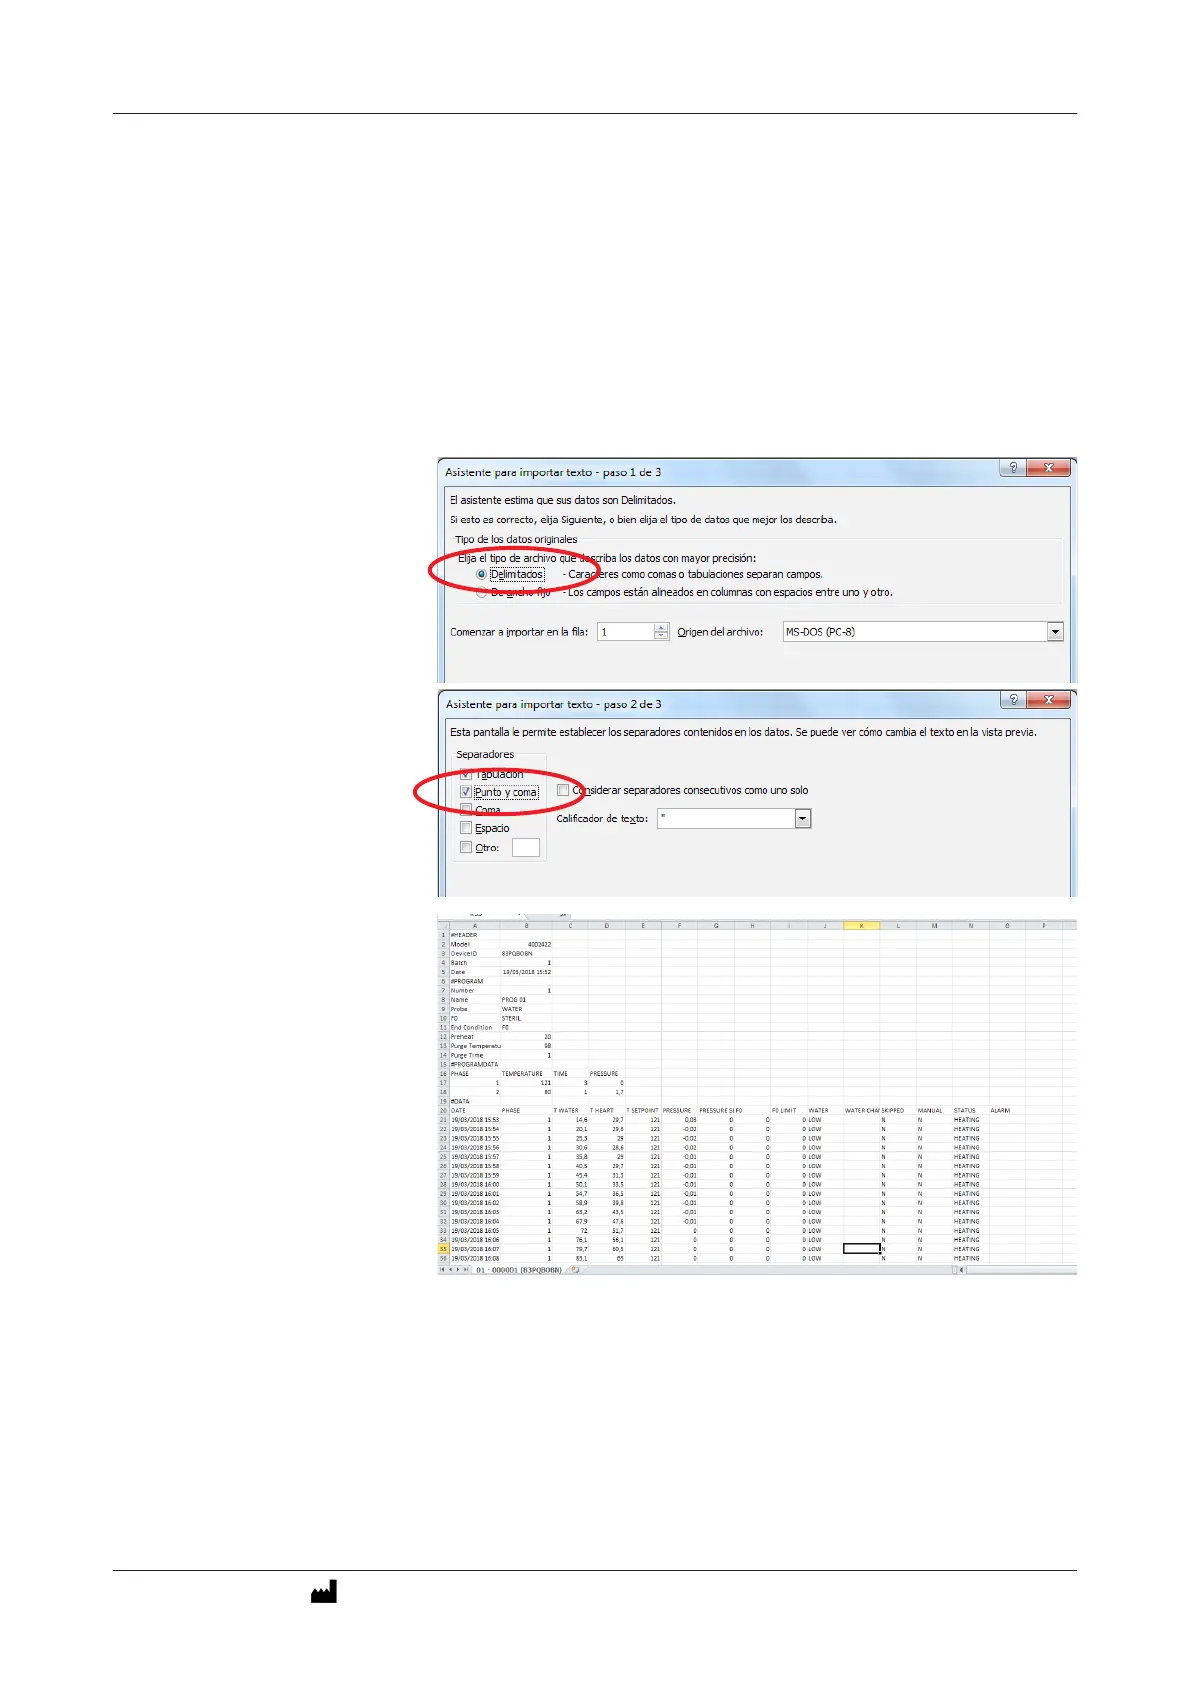
Perform the following operations to create a graph:
Start Excel
Open
All the les
Select the le
Open
«Delimited» Next.
«Semicolon» (punto y coma) Next.
Finalize
To make a graph with EXCEL, select rst the columns for water tempe-
rature, heart, pressure, Fo, etc ... and then point in the menu to create
the graph.