Shure Incorporated
18/29
◦
◦
Select Deploy to assign the frequencies to your devices and complete the coordination.
Tip: Re-sync portables if necessary.
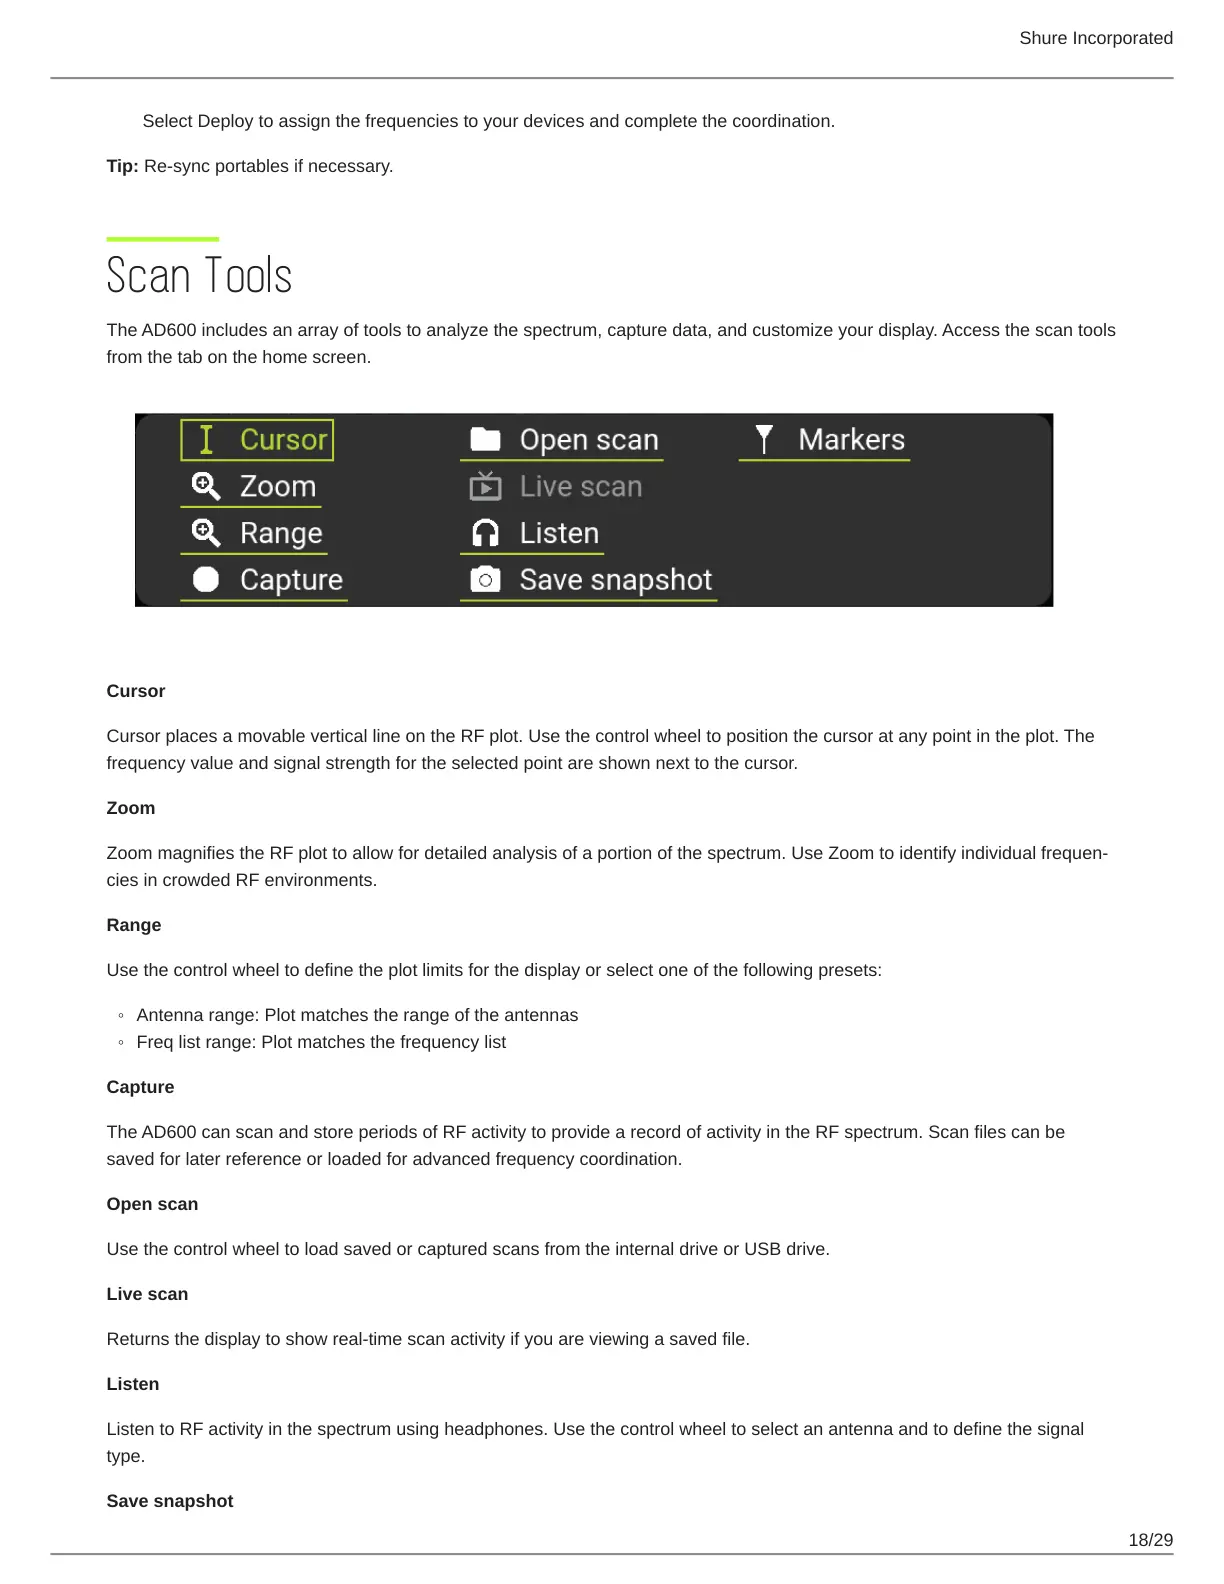
Scan Tools
The AD600 includes an array of tools to analyze the spectrum, capture data, and customize your display. Access the scan tools
from the tab on the home screen.
Cursor
Cursor places a movable vertical line on the RF plot. Use the control wheel to position the cursor at any point in the plot. The
frequency value and signal strength for the selected point are shown next to the cursor.
Zoom
ZoommagnifiestheRFplottoallowfordetailedanalysisofaportionofthespectrum.UseZoomtoidentifyindividualfrequen
cies in crowded RF environments.
Range
Use the control wheel to define the plot limits for the display or select one of the following presets:
Antenna range: Plot matches the range of the antennas
Freq list range: Plot matches the frequency list
Capture
The AD600 can scan and store periods of RF activity to provide a record of activity in the RF spectrum. Scan files can be
saved for later reference or loaded for advanced frequency coordination.
Open scan
Use the control wheel to load saved or captured scans from the internal drive or USB drive.
Live scan
Returns the display to show real-time scan activity if you are viewing a saved file.
Listen
Listen to RF activity in the spectrum using headphones. Use the control wheel to select an antenna and to define the signal
type.
Save snapshot