03/2013 2 Machine information
2.2 Variable monitors – time Series – measurements and measurement series
© Siemens AG 2006-2013 All Rights Reserved
SINUMERIK Integrate AMB, AMC, AMM, Function Manual (FH) - 03/2013
2-53
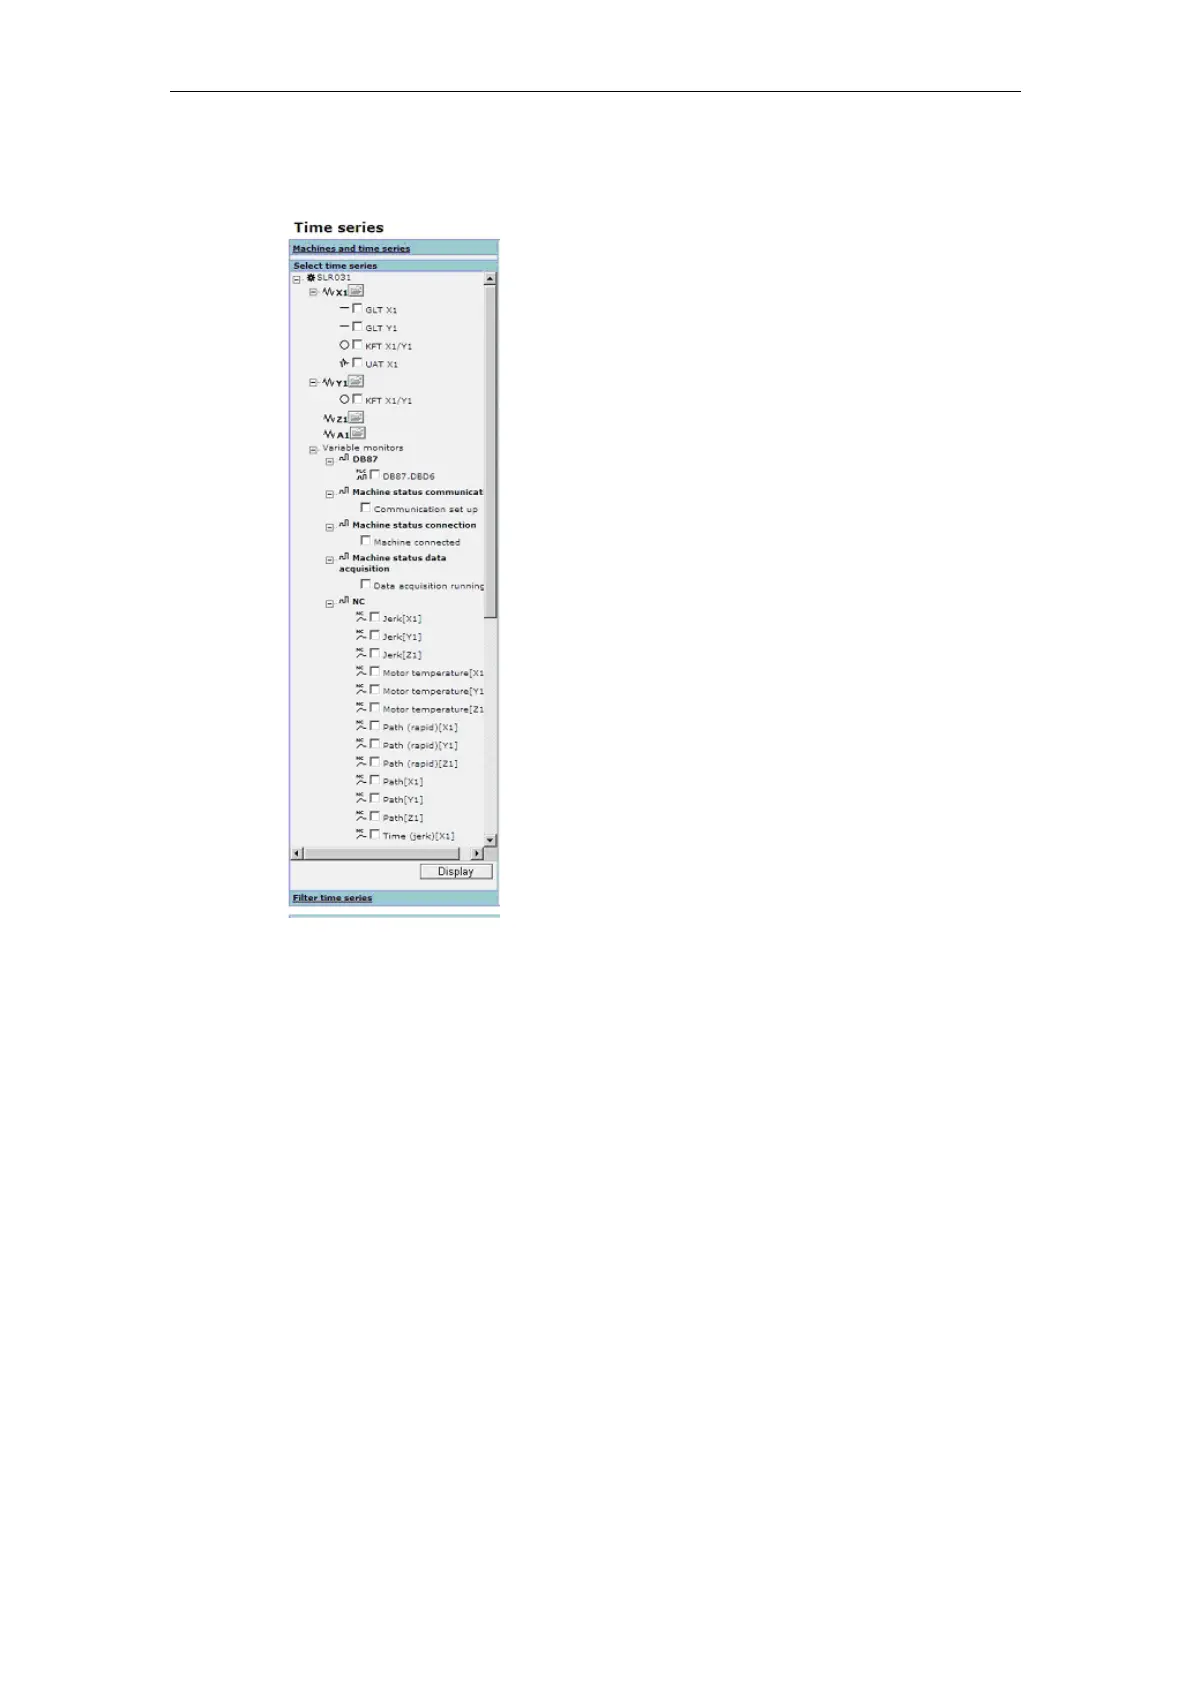
Selection and filter area
Fig. 2-31: Select variable monitors
Displaying diagrams of the selected variables
To display variables in a diagram, select them in the selection area. Activate the
"Display" field to display all selected variables in one common diagram in graphs.
Any variables from different variable monitors can be displayed together in one
diagram. If you select additional variables and activate the "Display" button, a new
diagram is created which displays the newly selected variables. Any number of
diagrams can be generated.
Operating the diagrams
The diagrams for displaying variable monitors are operated in the same way as the
diagrams for displaying measurement series. Some of the available functions may
differ slightly due to the differences between measurement series and variable
monitors. These differences are described in more detail in the following sections.
 Loading...