2 Machine information 03/2013
2.2 Variable monitors – time Series – measurements and measurement series
© Siemens AG 2006-2013 All Rights Reserved
2-46 SINUMERIK Integrate AMB, AMC, AMM, Function Manual (FH) - 03/2013
2.2.3 Control elements of the diagrams for individual measurements
Fig. 2-26: Header line for individual measurement diagram
Selecting the characteristic
The drop-down list box contains the list of characteristics that are available for each
type of test. If you click a name of the characteristic, then the characteristic that has
been displayed up until this point is replaced by the new one.
New characteristic in a separate diagram
If you click the "Display in new diagram" button on the right-hand side next to the
drop-down list box of characteristics, a new diagram of the same type will be
displayed below the diagram that is already shown.
The new diagram adopts all display characteristics of the original diagram (marks,
zoom, etc.).
Where individual measurement diagrams are concerned, the "Actions" menu and
context menu have the same options:
Function Description
Parameters Shows the pop-up window with the list of measurement
parameters. The same pop-up window can be opened
from the context of the time series.
General conditions Shows the pop-up window with the list of measurement
parameters.
Comment Pop-up with measurement comment.
Scaling Selection of the diagram scale (only for the equability
test). In the case of the diagrams for the circularity test
and universal axis test, the "Actions" menu does not
contain "Scaling".
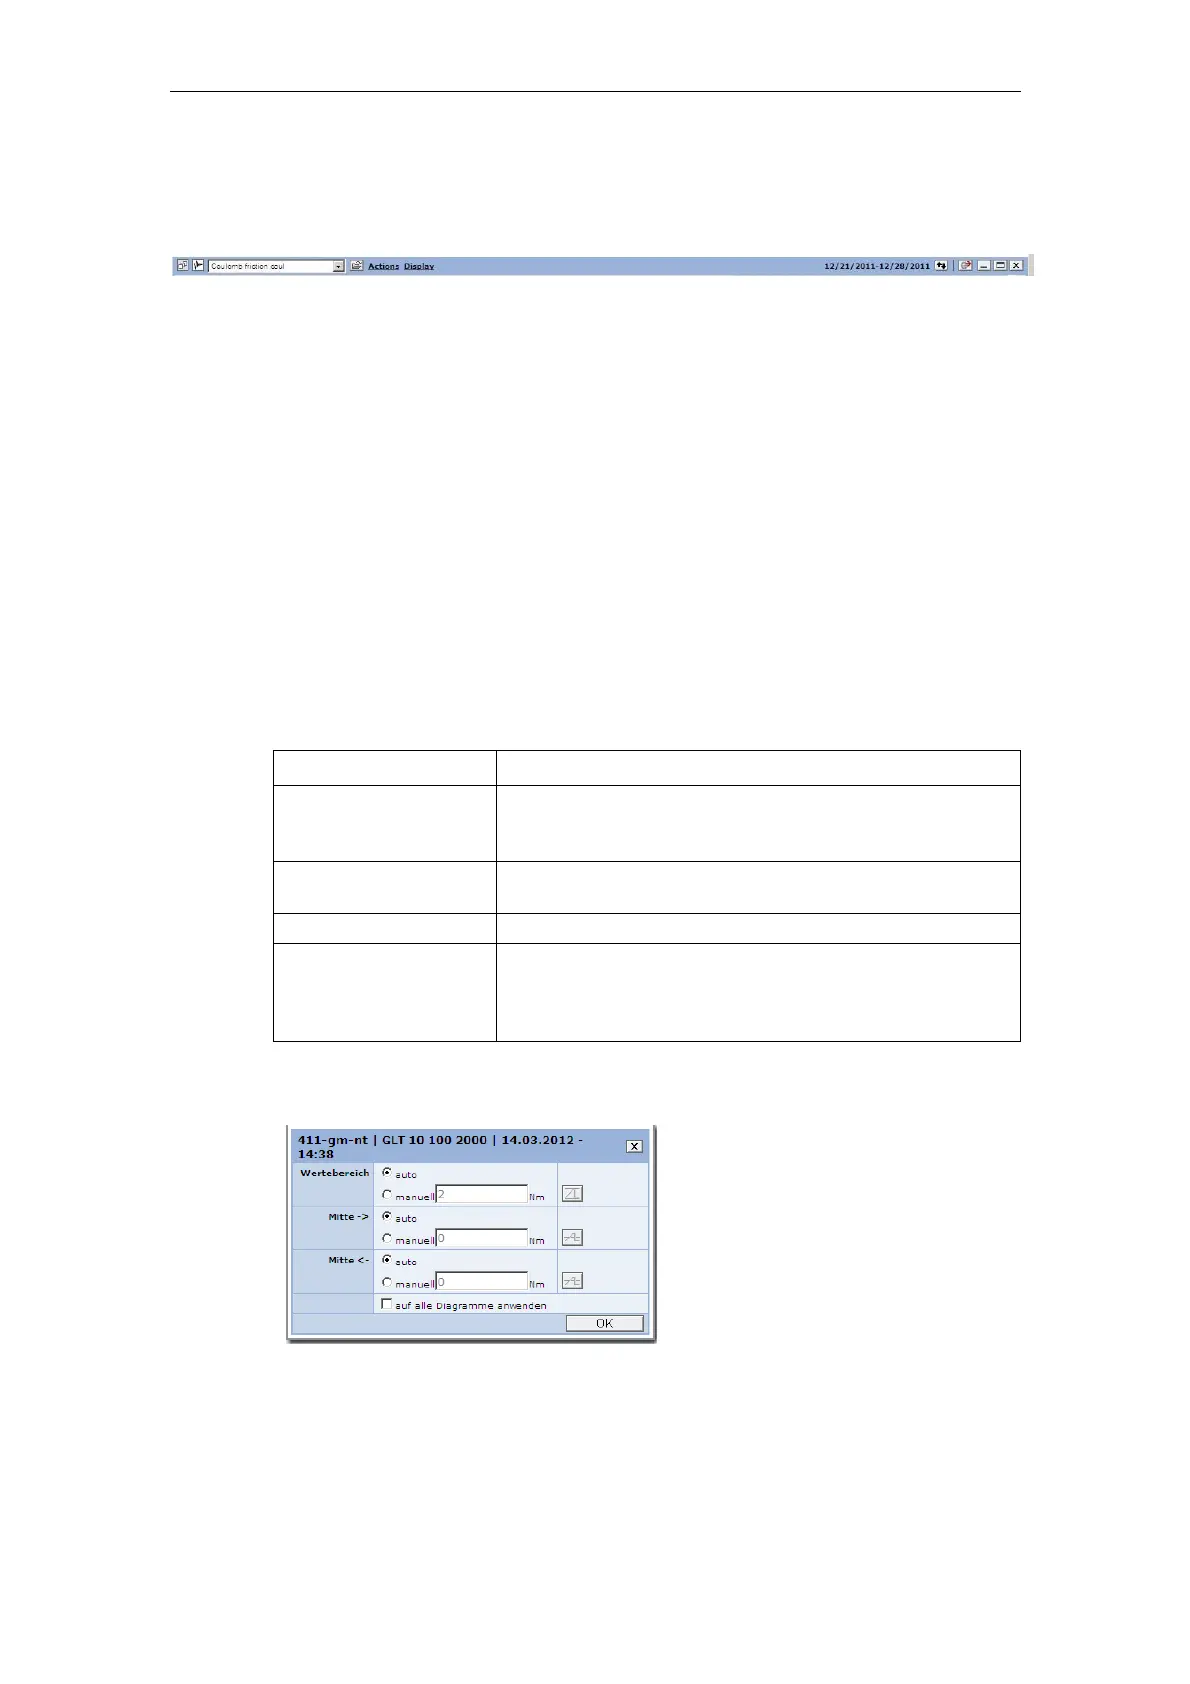
Scaling for the equability test
Fig. 2-27: Scaling for the equability test
 Loading...