16
8.4 Data Analyzer Software
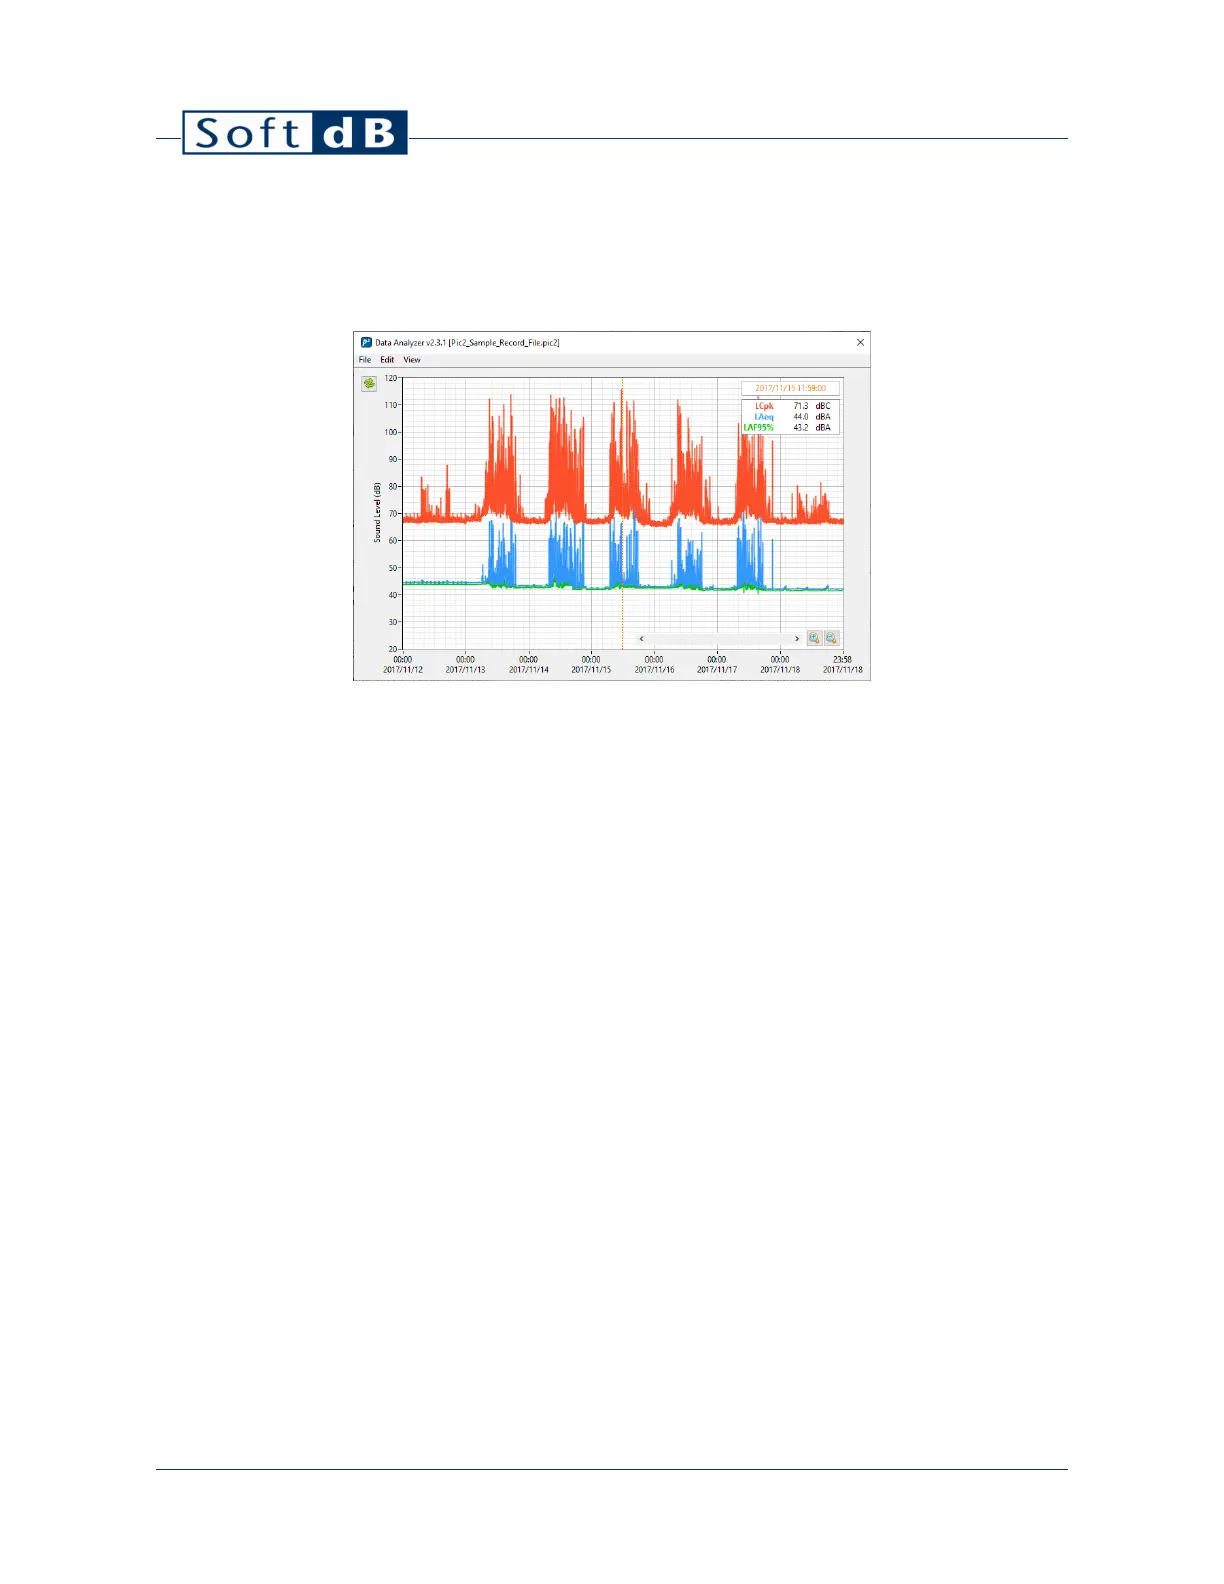
The “Data Analyzer” software module allows viewing recorded measurements data, save it to a file
and export it to a text file.
The main interface shows a time history graph of all recorded measurements. You can add a data
plot by clicking on “Add Data” from the “Edit” menu.
Drag the cursor on the graph to update the legend values.
You can zoom in/out on the graph using the magnifier buttons or using the mouse wheel or the
up/down keys. You can also manually edit the axis minimum and maximum labels to set the range
to a specific value.
You can move the time range by moving the scrollbar at the bottom, or by dragging the cursor on
the graph limits or by using the left/right keys.
Click on “Show Details” from the “View” menu to open the record details panel. This panel shows the
details of the record indicated by the cursor. Moving the cursor on the time history graph updates
the displayed information.