17
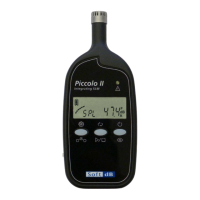
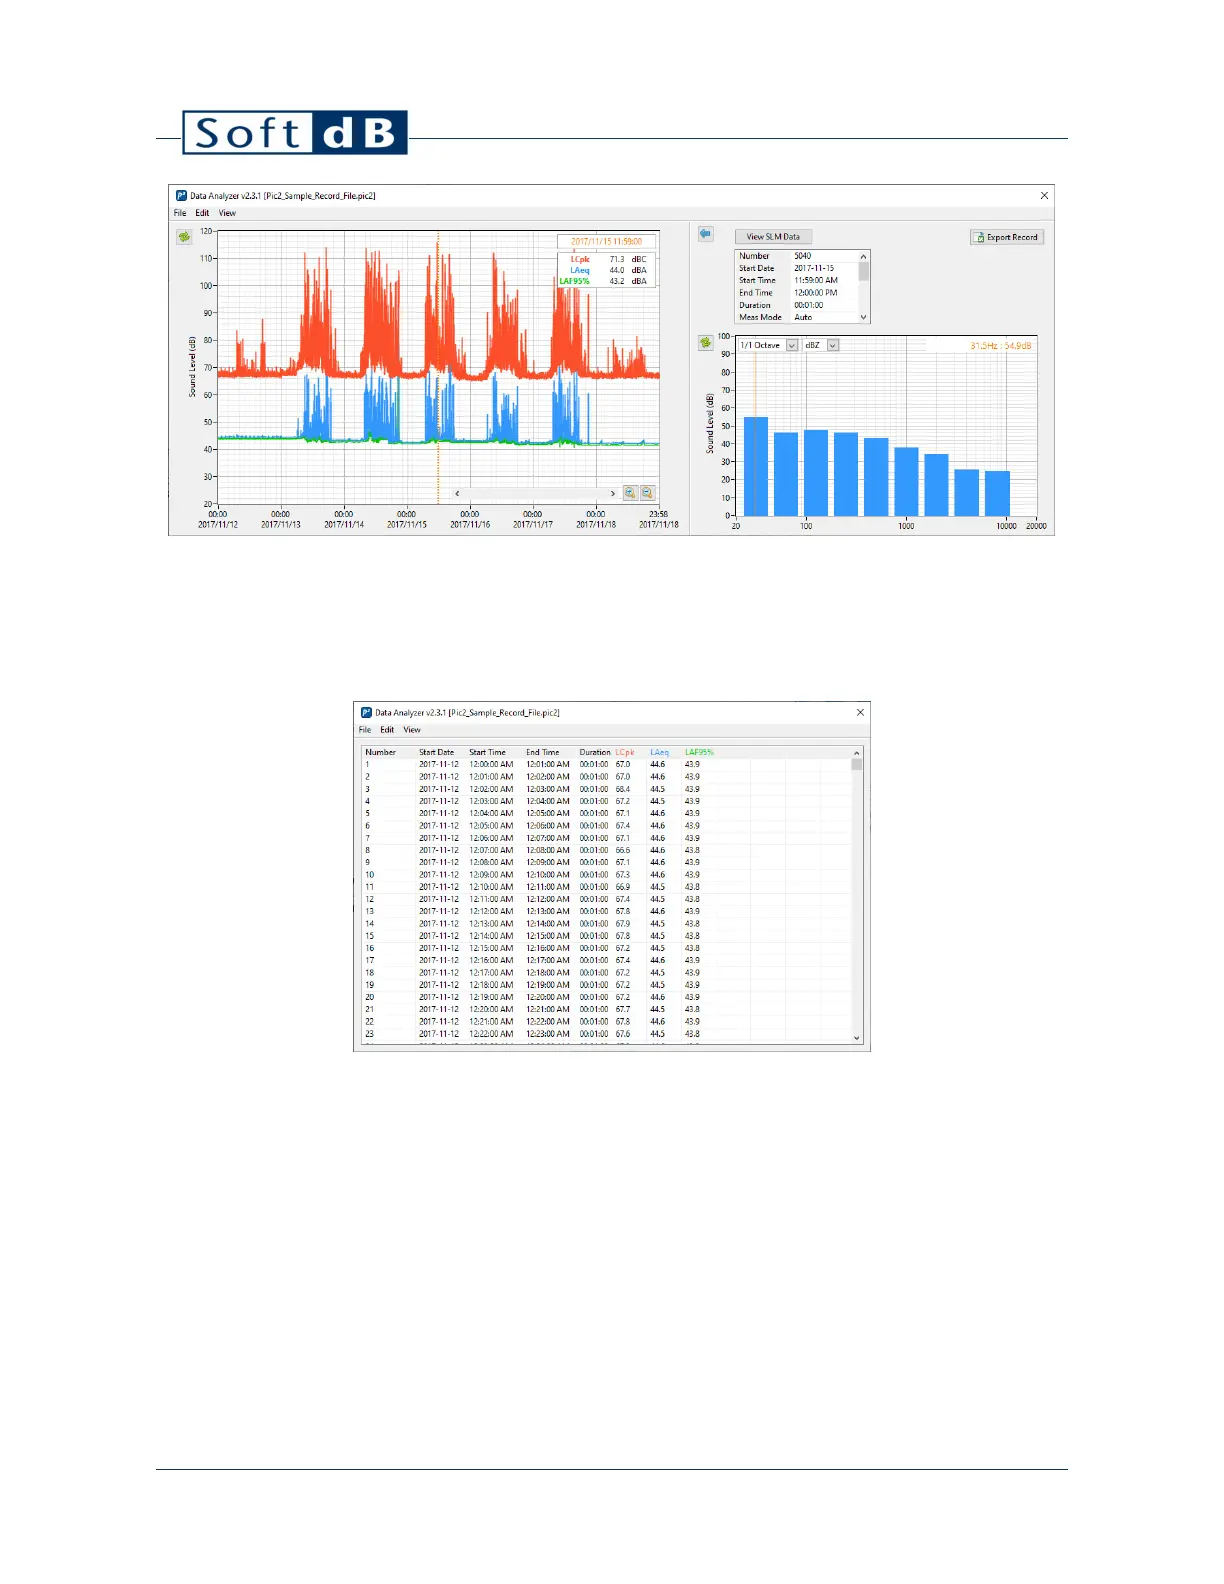
Click on “Records Table” from the “View” menu to show the recorded measurements as a table. When
displaying the list, click on “History Chary” to go back to the time history graph. Note that displayed
data curves on the time history graph will appear as data columns in the list view. The selected row
in the list is linked to the cursor on the time history graph
Click on “Save” or “Save As” from the “File” menu to save the records in a *.pic2 file.
Click on “Export” from the “File” menu to export the data in a tab delimited file.
8.4.1 Trim Records
Click on “Trim to Time Range” from the “Edit” menu to keep only visible recordings from the History
chart. Be sure to save this new dataset as a new file.
8.4.2 Compute Longer Intervals
You can recompute longer intervals by clicking on the “Calculate Longer Intervals” from the “Edit”
menu. Note that only contiguous records will be considered; any discontinuity will remain.